
Use Divergences For Swing Trades

There are many different ways to measure the technicals for a particular stock, ETF or index. The most popular are the relative strength index, (RSI), stochastics and MACD. I personally like to use the price oscillator, as it seems to work best for my trading style.
Traders use these technical indicators to determine whether or not the instrument they are trading is overbought or oversold. Once it becomes oversold, they would typically be looking to buy and when overbought, looking to sell.
But there is a way to increase your odds of making winning trades. Things can stay very overbought and/or oversold for a long time, so just taking a position on that is not a high odds trade set up.
When you start to see divergences in price and technicals, the odds increase for a reversal. A bearish divergence is when the technical indictor is making lower highs as price is making higher highs. A bullish divergence is when the technical indicator is making higher lows as price is making lower lows.
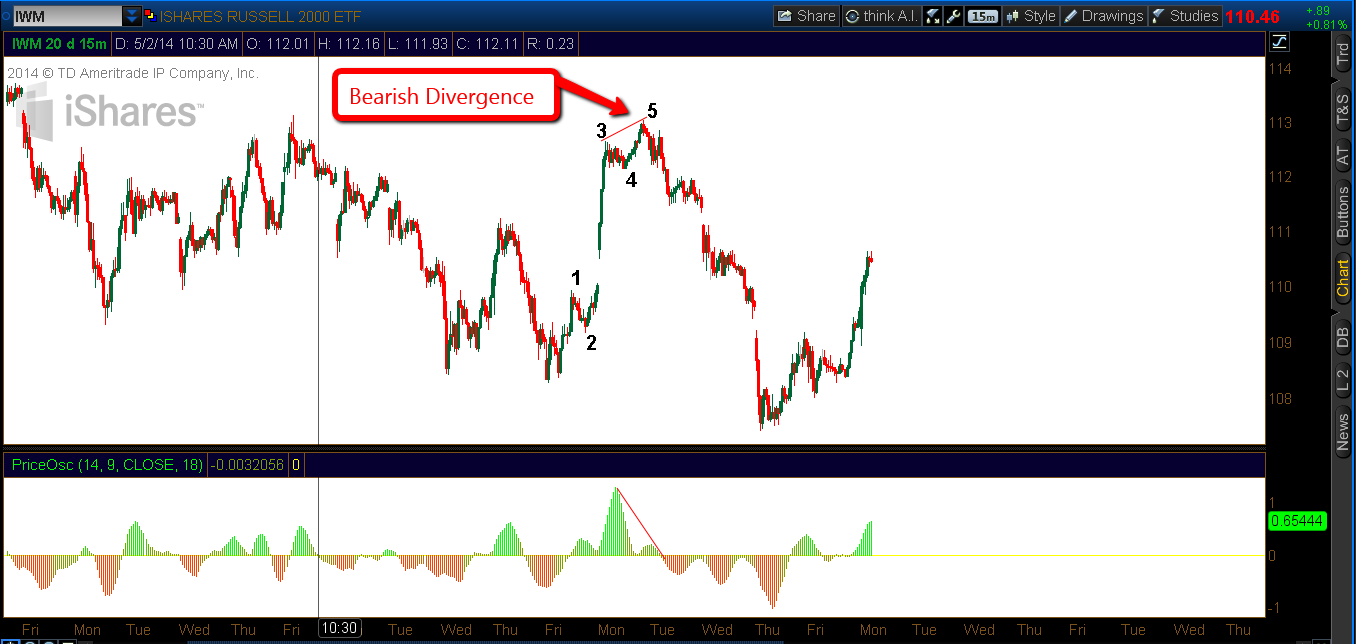
Typically, you will see these divergences take place during fifth wave action (Elliott wave analysis). Look for divergences on different time frames. For our trades at Marketspath.com, I only use the 60-minute chart to determine the short term trend. But we will make trades (entries/exits) from the 15-minute charts. Trend durations typically last between 10-20 days, which is perfect for short term swing trades.
SUMMARY
Use the 60-minute charts to determine trend. When you see bearish or bullish divergences on the 60-minute charts, be ready for a trend reversal that should last anywhere from 10-20+ days. The 15-minute divergences, when matched up with Elliott Wave counting, are used for entries or exits within the 60 minute trend.
= = =
Click here to see exactly where we are now
