
Technical Analysis: Using Multiple Timeframes

The objective of any trading strategy is to identify trading entries with a high positive predictive value: i.e. the sensitivity and specificity of the order are likely to be successful close to 90% of the time.
Getting Started
In order to achieve this —the market must be defined or broken down into two separate energies: 1) price action or market structure and 2) indicator analysis. Both parameters provide separate information that must be integrated in order to evaluate the predictive value of a market set-up.
Multiple Time Frame Analysis
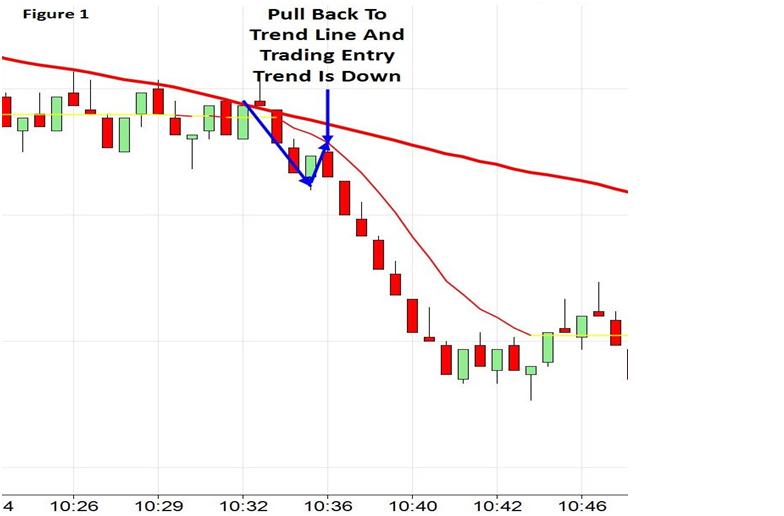
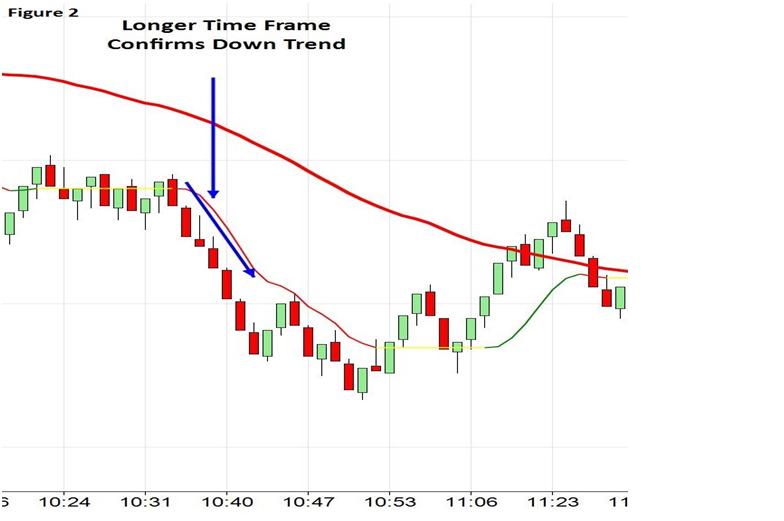
In order to further enhance the precision of a trading entry multi-time frame analysis should be utilized. In its simplest form trades are executed in the direction of the trend on the higher time frame (Figure 2), using a pull back on the shorter time frame as the entry trigger (Figure 1). This is a rational approach to trading.
Use Confirmation
The problem with this type of simple market analysis is the difficulty in discriminating between a short term time frame pull back from a market reversal. Thus, simple trend analysis is insufficient to provide the precision we need to be consistently profitable traders. This is why trades based on market structure analysis (or trend analysis) require confirmation via the use of indicator analysis.
Three Tools
The first indicator to be discussed is that of MACD (moving average conversion divergence). MACD defines momentum on any time frame and in any market. The MACD consists of a signal line (slow moving average) and a fast moving average. When the fast moving average is accelerating away from the slower, momentum is increasing. When the fast moving average is decelerating back towards the slower moving average momentum is decreasing.
The second indicator is that of order-flow analytics. This is a relatively new tool that we can use to assess potential market direction. Order-flow tells us the number of orders executed at the bid and ask at any given tick level. At any given instant, order flow is the same on all time frames but the comparison of order-flow direction is not. For example, the change in magnitude of orders executed at the bid looking back on a 5-minute chart would not be same if the look back was on a 10 minute chart.
The final indicator we use to predict market direction is the oscillator. There are many different types and include, stochastic, relative strength and the commodity channel index (CCI). Each oscillator creates its patterns using a different mathematical equation but all serve to evaluation momentum. When the close of a bar or candle continues to approach its high or low, the oscillator rises or falls respectively. As the close of the move retreats from the high or low of the bar or candle the oscillator will begin to change direction.
Key Takeaways
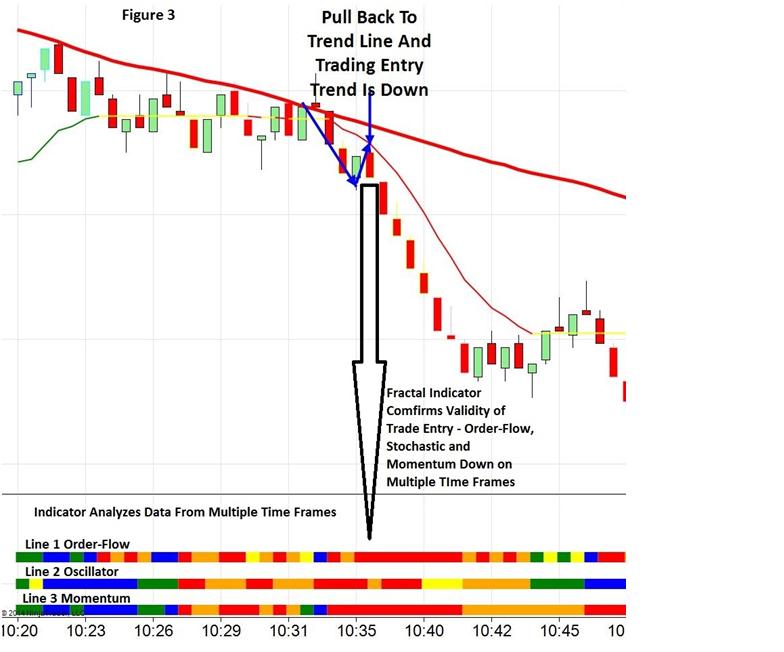
Putting it all together, we seek to perform indicator analysis and market structure analysis on a given market on multiple time frames simultaneously. This will significantly enhance the positive predictive value of our trading entries. The downside that is incurred is that looking at multiple time frame charts can be cumbersome and confusing and superlative trading entries can be missed. This is why fractal indicators have been developed. Fractal indicators assimilate data from multiple time frames and trace out the results on your trading chart. Fractal indicators eliminate the need for multiple time frame charts (Figure 3).
= = =
Mark Sachs
Right Line Trading
