
Percent Range, better known as Williams %R
Background: %R was developed by well-known trader Larry Williams in the 1970s as a variation of stochastics. Instead of relating the latest close to the lowest low during a specified period, %R relates the close price to the highest high.
Purpose: While %K in stochastics compares the closing price with the lowest low for a period, %R compares the close with the highest high. Instead of the index scale reading from 0 to 100, as it does with stochastics, the scale is reversed with 0 at the top and 100 at the bottom. Actually, if you take 100 minus %K in stochastics, you can arrive at %R.
One of the differences between %R and stochastics is in appearance, as the chart below illustrates. %R does not use a 3-day moving average of %K as stochastics does but is presented as just a single line. %R also usually involves a longer time period than stochastics.
Basic signals: Because %R features only one line, there are no crossovers of lines for trading signals as is the case with stochastics. Instead, the status of the %R reading is most important. If the reading is less than 30 (at the top of the chart), the market is considered to be overbought; if the reading is more than 70 (at the bottom of the chart), the market is considered to be oversold.
The concept of divergence/convergence is an important signal in %R as it is in a number of indicators – that is, prices make a high that is higher than the previous high but %R makes a high that is lower than the previous high, indicating a market that may be ready to turn lower. Or a market ready to turn to the upside may show prices are lower than a previous low but %R shows a higher low than the previous low.
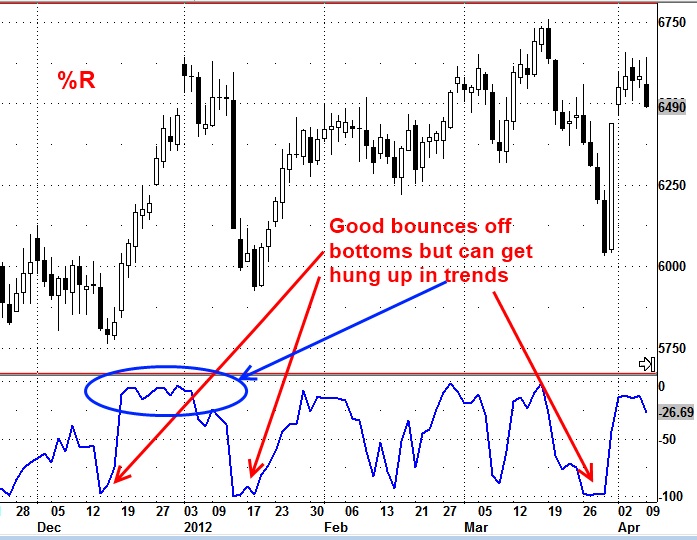
Pros/cons: %R provides much of the same information as the %K line from stochastics so offers no new insight if these two indicators are used together. As with stochastics, one of the issues with %R is that it works better in sideways or churning conditions but may get hung up on an upper overbought or lower oversold threshold when the market is making a strong price trend.

