
Volume and Open Interest
Background: By themselves, volume and open interest data may not be that valuable aside from indicating the liquidity of a market. But, used in conjunction with price action, these numbers serve as a strength indicator that can provide meaningful verification about the significance of a price move. They have long been popular as indicators because they do not require computer power to provide price clues like more complex indicators that massage price data do.
Volume is the number of transactions that take place during a specified period of time, usually one trading session. In most auction markets such as the New York Stock Exchange or futures or options markets, one buy and one sell equals a volume of one. As a dealer market, Nasdaq may report a volume of two for the same transaction – one when a trader sells shares to a dealer and one when another trader buys the 100 shares from the dealer.
Open interest is the total number of futures or options contracts that have not yet been offset or fulfilled by delivery. If a new buyer (a long) and new seller (a short) enter a trade, their orders are matched and open interest increases by one. If a trader who has a long position sells to a new trader who wants to initiate a long position, open interest does not change as the number of open contracts remains the same. If a trader holding a long position sells to a trader wanting to get rid of his existing short position, open interest decreases by one as there is one less open contract.
Purpose: Volume and open interest reflect traders’ enthusiasm about participating in a market at a given price. If traders become anxious to get into or out of positions, they may drive volume up for that session; if they have little interest in trading a dull market, volume is likely to go down. Comparing figures from market to market or from session to session has implications for the price outlook.
Stocks have a fixed number of shares so volume reflects the number of shares that change hands during a session. This number indicates the market’s breadth and offers clues about how meaningful the price movement in the market is.
Futures and options do not have a set number of contracts and no limit on how many contracts can be outstanding – theoretically, the number of contracts open could grow to any number, depending on market activity. The open interest figure indicates the depth or liquidity of a market, which influences a trader’s ability to buy or sell at or near a given price without a lot of slippage.
Basic signals: Volume and open interest are “secondary” technical indicators that help confirm other technical signals. The real significance of volume and open interest lies in their correlation to price. In general, if these two figures and high and rising, the existing trend strong; if volume and open interest are low and declining, the trend is weak.
Here are some general guidelines on how the interaction of price and volume/open interest might affect value:
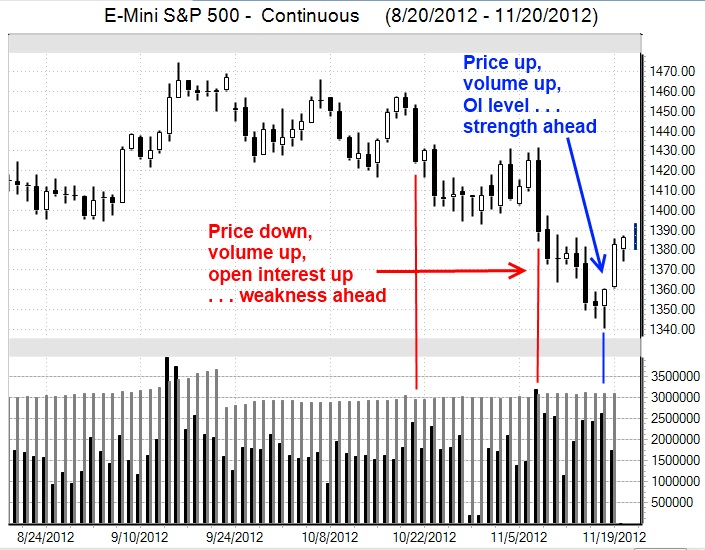
- Price up, volume up, open interest up – bullish as it indicates traders still want to buy despite the higher price.
- Price down, volume up, open interest up – bearish as increasing volume is driving the market lower.
- Price up, volume down, open interest down – reduced buying interest and a possible market top.
- Price down, volume down, open interest down – decreased selling interest at lower prices, indicating a bottom may be in place.
There are a number of other possible combinations, some of which are neutral for future price action. Generally, a price breakout on heavy volume is a strong signal the move may continue as more traders get into the market; a big price move on light volume suggests not many traders are willing to pursue the move, meaning a top or bottom may be near or in place.
To validate an uptrend, volume should be heavier on up days and lighter on down days within the trend. In a downtrend, volume should be heavier on down days and lighter on up days. Changes in open interest measure how much money is flowing into or out of a market, which helps evaluate a trending market. Very high open interest at market tops can cause a steep and quick price downturn. Open interest that builds up during a “basing” period can strengthen the price breakout when it happens.
Open interest does have seasonal tendencies – that is, in some markets it is higher at some times of the year and lower at others. Traders will need to look at five-year seasonal averages of open interest and then compare the current situation with the average.
If prices are rising in an uptrend and total open interest is increasing more than its seasonal average, it suggests new money is flowing into the market and aggressive new buying. That is bullish. But if prices are rising and open interest is falling by more than its seasonal average, the rally is the result of holders of losing short positions liquidating their contracts (short-covering) and money is leaving the market. This is usually bearish, suggesting the rally is ending.
Pros/cons: The correlation of volume/open interest and price is not perfect, as illustrated during the September period on the chart below when both price and volume surged higher as E-mini S&P 500 Index futures and options were in the quarterly expiration cycle. But volume/open interest do provide clues about what could happen to price based on market activity. These indicators are not price-based and provide insight that is not available from other indicators. However, they do not stand alone; traders will have to use chart patterns or other technical indicators to make decisions about where to place orders.
Although stock markets generally provide a running tally of volume during a session, futures exchanges usually do not release that data until the following day, limiting the timeliness of making a decision using these indicators.

