
Rate of Change Indicator ROC
Background: The Rate of Change indicator is another view that looks just like the Momentum Indicator on a chart. Most of the comments for the Momentum Indicator also apply to the ROC except that ROC is a ratio or percentage value instead of a price. In some versions, the center line has a reading of 100 instead of 0. For a 10-day ROC indicator, the current close is divided by the close 10 days ago.
Purpose: As with the Momentum Indicator, traders are trying to identify how fast prices are moving. Is the price move accelerating and at what velocity? Or is a price move beginning to lose its strength or momentum?
Basic signals: The ROC indicator moves above and below a midline or centerline, depending on the ratio of the current price to the price N periods ago. If the ROC is above the zero line and rising, prices are accelerating higher; if the ROC is above the zero line but falling, it indicates prices are still rising but at a lower rate.
The same set of clues applies to the downside. If the ROC is below the zero line and falling, the downtrend is accelerating; if the ROC is below the zero line and rising, it suggests the market is not falling as fast and the bearish move may be near its exhaustion.
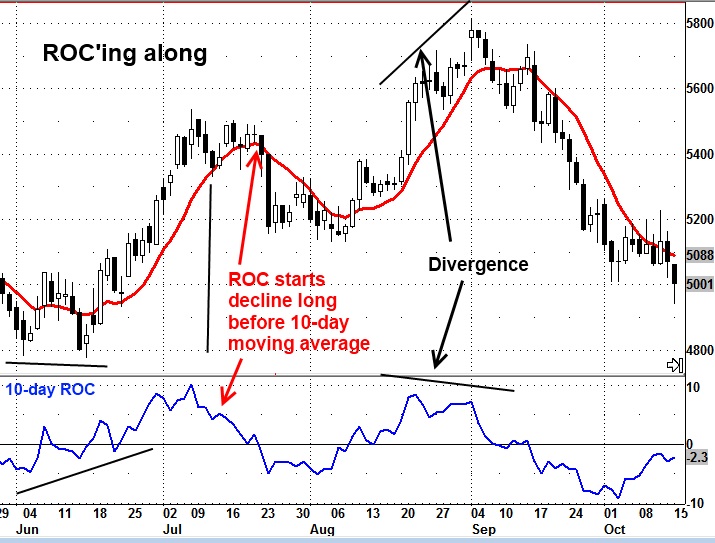
Compare the ROC indicator on the chart below with the MOM indicator chart covering the same market and the same time period. They look the same. Like the MOM indicator, the ROC indicator starts a move ahead of a price move, providing an early alert to a potential trend change, and divergence between prices and the indicator offer clues that a trend is exhausting.
In addition to trading crossovers or trading in the direction of the ROC trend, some traders also use extreme readings in the ROC for contrarian types of trades – sell as ROC reaches highs or buy as ROC hits lows.
Pros/cons: While moving averages tend to lag prices, the ROC is a leading indicator because, by the nature of its construction, it reflects the loss of momentum as prices approach a potential top or bottom. But keep in mind that there is no upper or lower limit for a ROC reading, and a market can stay at a “high” or “low” for some time. Some signals may work well; others may not.

