
Strength Indicator: On-Balance Volume
Background: The vertical bars showing volume on the bottom of price charts provides a quick visual picture of how market activity is quantifying buying and selling pressure, but raw volume numbers for a given period are not precise enough to really show volume flow. To get more detail out of volume, legendary trader Joe Granville introduced on-balance volume (OBT) in 1963, which uses volume at different prices to produce a line that makes the trend in volume easier to see than with the traditional vertical bars.
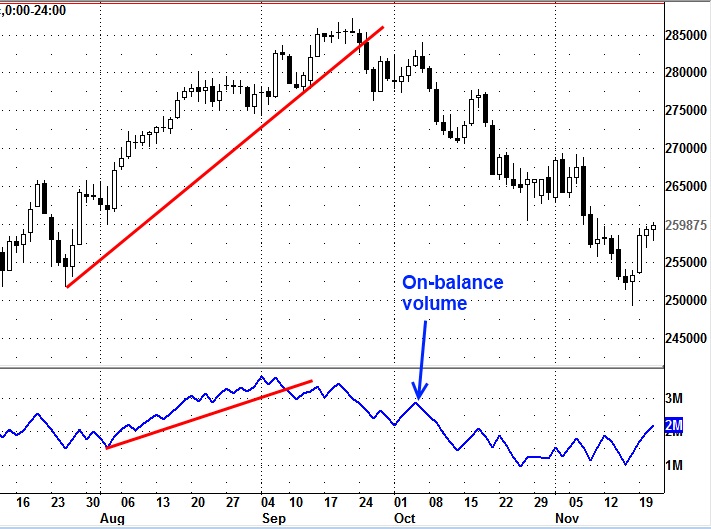
Purpose: OBV attempts to show simply and clearly whether heavier volume is taking place on the upside or the downside. Based on whether prices close higher or lower, the total volume is given a plus or minus value. An accumulation of these values produces the OBV line shown on the chart below that confirms the quality of the trend or indicates that a change may be coming if the direction of the OBV line diverges from the direction of price.
As is often the case with indicators, various attempts have been made to refine the OBV data in situations where a market may close only slightly higher but still gets all the volume assigned to the plus side or slightly lower with all of a period’s volume credited to the minus side. Different weighting techniques have been used to produce variations such as James Sibbet’s Demand Index or the Herrick Payoff Index.
Basic signals: The key usefulness of OBV is the OBV trend, which should be moving in the same direction as the trend in prices. When the direction of OBV diverges from the direction of prices, it suggests a potential reversal in the price trend. Note the divergence on the chart below where breaking the OBV trendline presaged the break in the price trend.
Many technicians view volume as sort of a pressure gauge for a market, with more volume/pressure increasing the strength of a trend. They believe that shifts in volume will occur before shifts in price, giving OBV the status of an early alert indicator for prices.
Pros/cons: OBV is not based on price but, as with other indicators, is used in correlation with price to provide clues about future prices. Perhaps the biggest advantage of OBV is the simplicity of its construction and the simple reading of what the OBV line reveals – either it is going with prices to confirm the price trend or it is going against the price trend to indicate a possible change in price trend.
OBV does have weaknesses associated with those days when the close is only slightly different from the day before or when most of a day’s price activity is on one side but then moves to the other side on the close. Like volume, OBV is not as useful in futures due to the day’s delay in the exchange’s reporting of volume.

