
Pivot Points Are A Predictive Indicator

A “pivot point” is a price level of significance in technical analysis.
A Little Background
Pivot points are used by professional traders, market makers and Algos, as a “predictive indicator” of where support and resistance is. The central pivot point(P) is calculated by adding up the high+low+close/3 from the prior trading period(day, week, month or year).
A pivot point and the associated support(S) and resistance(R) levels are often turning points for the direction of price movement in a market. In an up-trending market, the resistance levels (“R” pivot points) may represent a ceiling level in price above which the uptrend is no longer sustainable and a reversal may occur. In a declining market, the support levels (“S” pivot points) may represent a low price level of stability where a reversal may occur. When a reversal does occur, they tend to move back to the central pivot point(P). That is where price is the most fair for that period(day, week, month or year).
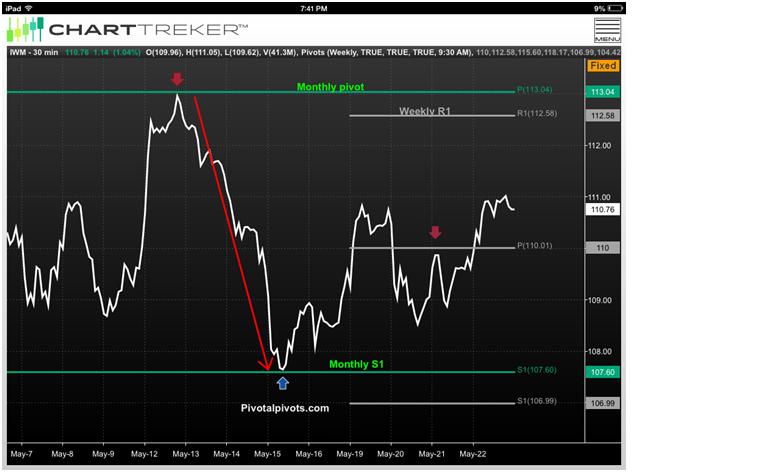
Identify Turning Points
By using a combination of daily, weekly and monthly pivot points, a trader can visually identify where price should change direction (see figure 1). Most charting software has pivot points listed as an indicator or as a study.
Pivot points are free and soon will become your favorite indicator in your tool box.
= = =
Learn more at Pivotal Points, financial markets research.
