
The One Technical Analysis Tool You Need

Everyone has their own favorite technical analysis tool – and for me that is no different; I like plotting support and resistance using Fibonacci Retracements. Fibonacci Retracements are key levels using numbers identified by the mathematician Leonardo Fibonacci – most commonly 23.6, 38.2, 50, 61.8 and 100.
Without going too much into Fibonacci and the Golden Ratio, from a technical analysis perspective, Fibonacci numbers are extremely useful in determining how far a stock may pull back, or whether it will experience resistance in a move higher. At Tradespoon, we look for stocks to reach the 38.2 percent and the 61.8 percent retracements.
To successfully use Fibonacci Retracements, it is always important to correctly analyze the following:
- The timeframe: At Tradespoon, we provide short-term trading recommendations. We look at 30, 45, 60 and (sometimes) 90-day price action for levels of support and resistance.
- The fundamental picture and trend: Though some technical indicators can tell you the strength of a trend and the direction that a trade should be placed, Fibonacci Retracements only give the trader an idea at the levels that contain key support and resistance – not the direction. Earnings and other fundamental analysis are still extremely important.
- The high/low: Fibonacci Retracements can only be analyzed retroactively – that is after a high and a low are in place. Trying to look at retracements while the price is still around the high or low becomes extremely tricky.
Time Warner Cable
As you can see by the below chart of Time Warner Cable (TWX), the stock has gained from $55.71 to $66.01 over the past 90 days. Since then, prices retraced to $60.07 – nearly touching the 61.8 percent Fibonacci Retracement (near $59.65).
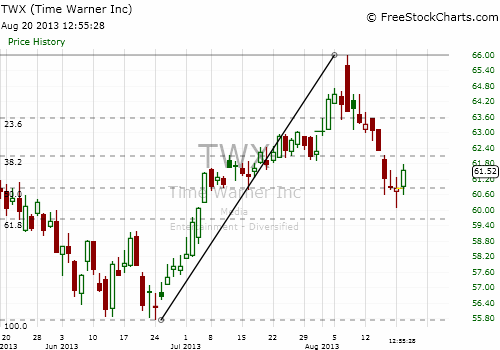
TWX is moving along its overall bullish trend – which has seen a more than 100 percent increase in the stock over the past five years. Analyzing the pull back with regard to the recent trend suggested that Fibonacci levels would be used as points of support, rather than opportunities for sellers, which we – in fact – saw. Since the low – at $60.07 – prices have rebounded to the mid-$61 mark, for a relatively painless 2.5 percent gain.
