Trend Indicator: Moving Average Convergence Divergence (MACD)

Background: The origination of MACD is generally associated with Gerald Appel in the 1970s, augmented with a histogram added by Thomas Aspray in the mid-1980s. Moving averages reveal the trend of a market, but as personal computers became more prevalent, traders were interested in a more detailed method of using the relationship between moving averages to find trading signals from price charts.
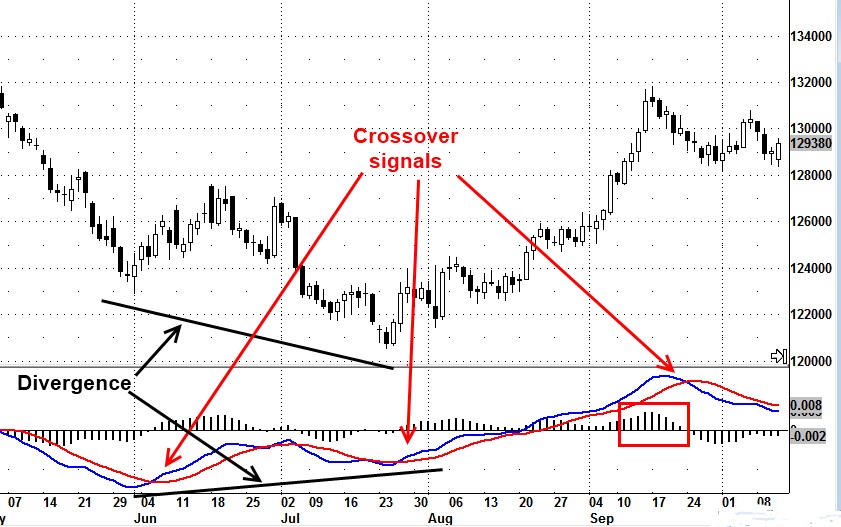
Purpose: MACD is useful for identifying price trends, spotting overbought/oversold conditions measuring the strength or weakness of a trend and indicating the momentum of market movements. MACD does this by plotting the difference between a longer-term exponential moving average and a shorter-term exponential moving average – often 26 periods and 12 periods – to produce a MACD line (blue line on chart below). Then another exponential moving average – often 9 periods – of the difference between the 26-period and 12-period EMAs is used as a signal line (red line on chart below) to trigger buy/sell decisions.
Basic signals: The MACD indicator is used in several ways:
Crossover signals When the MACD line – the difference between the two EMAs – crosses below the signal line – the 9-period EMA of the MACD line – it is a bearish signal; when the MACD line crosses above the signal line, it is a bullish signal. Another crossover signal occurs when MACD crosses above or below the zero line.
Overbought-oversold If the 12-period EMA pulls away from the 26-period EMA or diverges dramatically, it indicates the market may be getting overextended and is due for a correction to bring the averages back together (convergence).
Divergence As with other indicators, MACD can provide early clues about the divergences between prices and the indicator. If the MACD turns positive and makes higher lows while prices are making lower lows, as illustrated by the black lines on the chart below, this could be a strong buy signal. Conversely, if the MACD makes lower highs while prices are making new highs, this could be a strong bearish divergence and a sell signal. Frequently, the indicator will be a better indicator of the direction of a trend than price itself.
Histogram alerts MACD can also be shown as a histogram with each bar showing the difference between the 12/26 MACD line and the 9-period signal line. A reading of zero means no difference between the two lines. When the size of the histogram bars grows or shrink, it could be the first alert that the underlying strength or weakness of the market is changing. Note in the red box on the chart below that the histogram bars began to shorten several periods before the MACD line and signal line and before the crossover signal. This might be an early entry/exit clue for an aggressive trader. A more patient trader might wait for the histogram to move above the zero line to buy or below the zero line to sell.
Pros/cons: MACD has the advantages of moving averages in identifying trend direction and turns the power of moving averages up a notch by indicating whether that trend is gaining or losing strength. It can provide an early warning of possible trend shifts as the underlying momentum changes. At the same time, MACD is a lagging indicator like moving averages and requires rather strong price movement to generate a signal. It can work very well in a market that makes broad price moves but may get bogged down in choppy trading situations.