Unable to follow through on Tuesday’s bullish reversal action, stocks opened lower and sold off sharply during the first 90-minutes of trading. By 11:15 a.m. the major averages had erased all of Tuesday’s gains (on heavier volume) and undercut last week’s swing low. The ominous start turned out to be more bark than bite, as broad market averages bottomed out at mid-day, and climbed nearly 1% higher into the close. The afternoon rally lifted the averages off the lows of the day to close near the middle of the day’s range and above the 20-day EMA. The Russell 2000 gave back 1.5%. The Nasdaq Composite fell 1.3%. Both the Dow Jones Industrial Average and S&P 500 shed 1.1%. Mid-caps fared the best, with the S&P Midcap closing down just 0.8%.
Total volume jumped 19% above the prior days level on the Nasdaq, while NYSE volume ticked just 2% higher. Though the main averages attempted to rally into the close, the 1% loss across the board registered yet another bearish distribution day.
We continue to see bullish setups develop in the energy sector. Most of these patterns share the same cup and handle type look, as they are currently in pullback mode after a strong run up off the December lows. ProShares Ultra Oil & Gas (DIG) is the leveraged ETF representing a nice mix of industry groups within the sector. The daily chart below details the bullish action:

After a strong run up off the lows of December, DIG has pulled back and undercut support of the 20-day EMA. With the 50-day MA just below, we may see a few more days of consolidation or shakeout action, but the setup is buyable over the short-term downtrend line in red.
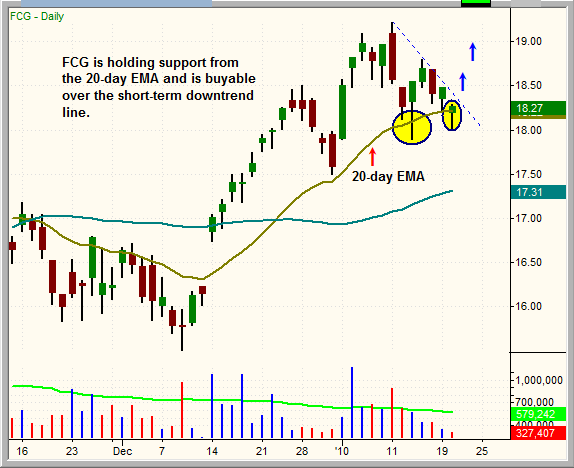
Sticking with energy, the next setup is a more focused play in natural gas stocks. First Trust Natural Gas (FCG) is setting up much like DIG (FCG tracks an index of natural gas stocks.)

FCG has held support of the 20-day EMA with two shakeout attempts on Jan. 13 and Jan. 20. Look for a break of the downtrend line as a potential entry point. As mentioned above in the DIG setup, there could be a few more days of downside before the pullback bottoms out and is ready to move higher. The best setups are often not so clean, as there are usually a few days of shakeouts to run the stops before the uptrend resumes.
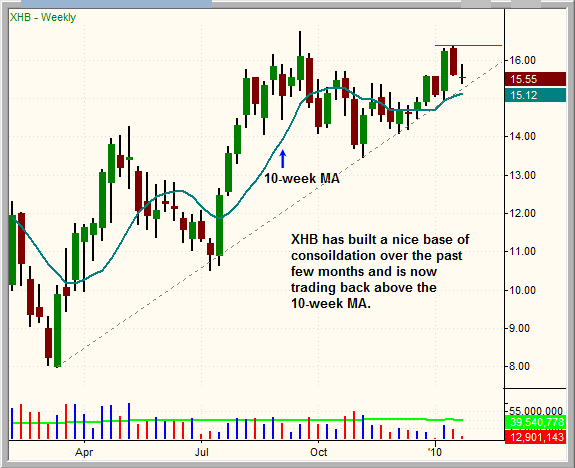
Switching from energy to financials, we continue to see the breadth of the financial sector improve with bullish charts in XLF, KIE, KBE, and RKH. We can also add the SPDR S&P Homebuilder (XHB) to this list. The weekly chart of XHB below shows a strong four month base that has formed a cup and handle type pattern.

Intermediate-term traders can establish a buy entry on a pullback to the 10-week MA, which would also coincide with the uptrend line around the $15.00 level. If nothing else, we can just use this chart as evidence that the breadth is expanding.

Yesterday’s reversal off the lows into close on the S&P 500 has created an obvious pivot level to monitor. Should the price action return back below this point (1,129), then we would expect a deeper pullback to the 50-day MA, around 1,113. A correction to the 50-day MA is only a 3% to 4% pullback off the January high. We could just as easily see this market continue to chop around in a range during earnings, which would allow the 50-day MA to catch up to the price action.
The wide ranged, chop fest in the broad market over the past three sessions can be very dangerous to a swing trader’s P&L and confidence. Bullish setups that stop out tend to look good the very next day since there is very little follow through to either side of the market. It then becomes very easy to overtrade, as the setup never really falls apart. Right now it’s best to remain mostly in S.O.H. (sit on hands) mode, with very minimal exposure.
Open ETF positions:
Long – UUP, PGM
Short (including inversely correlated “short ETFs”) – EEV
Deron Wagner is the Founder and Head Portfolio Manager of Morpheus Trading Group, a capital management and trader education firm launched in 2001. Wagner is the author of the best-selling book, Trading ETFs: Gaining An Edge With Technical Analysis (Bloomberg Press, August 2008), and also appears in the popular DVD video, Sector Trading Strategies (Marketplace Books, June 2002). He is also co-author of both The Long-Term Day Trader (Career Press, April 2000) and The After-Hours Trader (McGraw Hill, August 2000). Past television appearances include CNBC, ABC, and Yahoo! FinanceVision. Wagner is a frequent guest speaker at various trading and financial conferences around the world, and can be reached by sending e-mail to deron@morpheustrading.com.
DISCLAIMER: There is a risk for substantial losses trading securities and commodities. This material is for information purposes only and should not be construed as an offer or solicitation of an offer to buy or sell any securities. Morpheus Trading, LLC (hereinafter “The Company”) is not a licensed broker, broker-dealer, market maker, investment banker, investment advisor, analyst or underwriter. This discussion contains forward-looking statements that involve risks and uncertainties. A stock’s actual results could differ materially from descriptions given. The companies discussed in this report have not approved any statements made by The Company. Please consult a broker or financial planner before purchasing or selling any securities discussed in The Wagner Daily (hereinafter “The Newsletter”). The Company has not been compensated by any of the companies listed herein, or by their affiliates, agents, officers or employees for the preparation and distribution of any materials in The Newsletter. The Company and/or its affiliates, officers, directors and employees may or may not buy, sell or have positions in the securities discussed in The Newsletter and may profit in the event the shares of the companies discussed in The Newsletter rise or fall in value. Past performance never guarantees future results.
Charts created by TradeStation (tradestation.com).
© 2002-2009 Morpheus Trading, LLC
Reproduction without permission is strictly prohibited.


