
Equity Markets Look Vulnerable – Long and Short Term
Today kicks off the beginning of my involvement with the T3Live blog. Evan Lazarus has graciously allowed me to give it a go at adding some fresh content to this already amazing site. This weekend I spent several hours scrolling through previous post and was once again reminded that no matter how long you have been in this business (10 years and counting here) there is always something new which can be learned. Hopefully, you will be able to learn a trick or two from me and likewise through your comments and emails. So here it goes…….
Complacency has reigned supreme
During the past few weeks there has become an alarming increase in the amount of data demonstrating complacency comparable to prior significant turning points. Lately, I have been getting this feeling of deja vu as the market environment is becoming reminiscent of mid-2007.
In my view, now looks as good as any time since spring of 2009 for investors to demonstrate some vigilance and pare back on longer-term holdings. For short-term traders, this would be a good time to get your mind right and be prepared to take advantage of what will likely become a much more volatile and exciting trading environment.
Here are some bullets supporting the mid-2007 comparison:
- Several different types of Put/Call ratios have moved to multi-year extremes. Jason Goepfert at www.sentimentrader.com says “Large traders spent 43% of their volume buying call options, the 2nd-most of any week since the year 2000 (March 10, 2000 was the highest, at 43.1% of total volume).” THIS WAS ABOUT TWO WEEKS PRIOR TO PEAK IN THE TECH BUBBLE!.
- Unprecedented reach for yield by debt investors. According to Bloomberg, junk bonds are making up the biggest share of corporate debt sales on record as investors on an economic rebound snap up securities from even the first-time issuers. High-yield bonds yield an average of 8.59%, the lowest since October 2007. As of April 9th, the spread between high-yield and treasuries has fallen to near the lowest level since December of 2007 – 5.83%.
- Investor Intelligence Bull Ratio recorded 73.2% as
of 04/09/10. A reading which is near the upper 90 percentile of bullishness.
- Intermediate-Term Indicator Score at historical levels (The ITI Score was developed by the before mentioned Jason Goepfert.) Thursday’s score of 58% has only been achieved once during its 10+ years in existence.

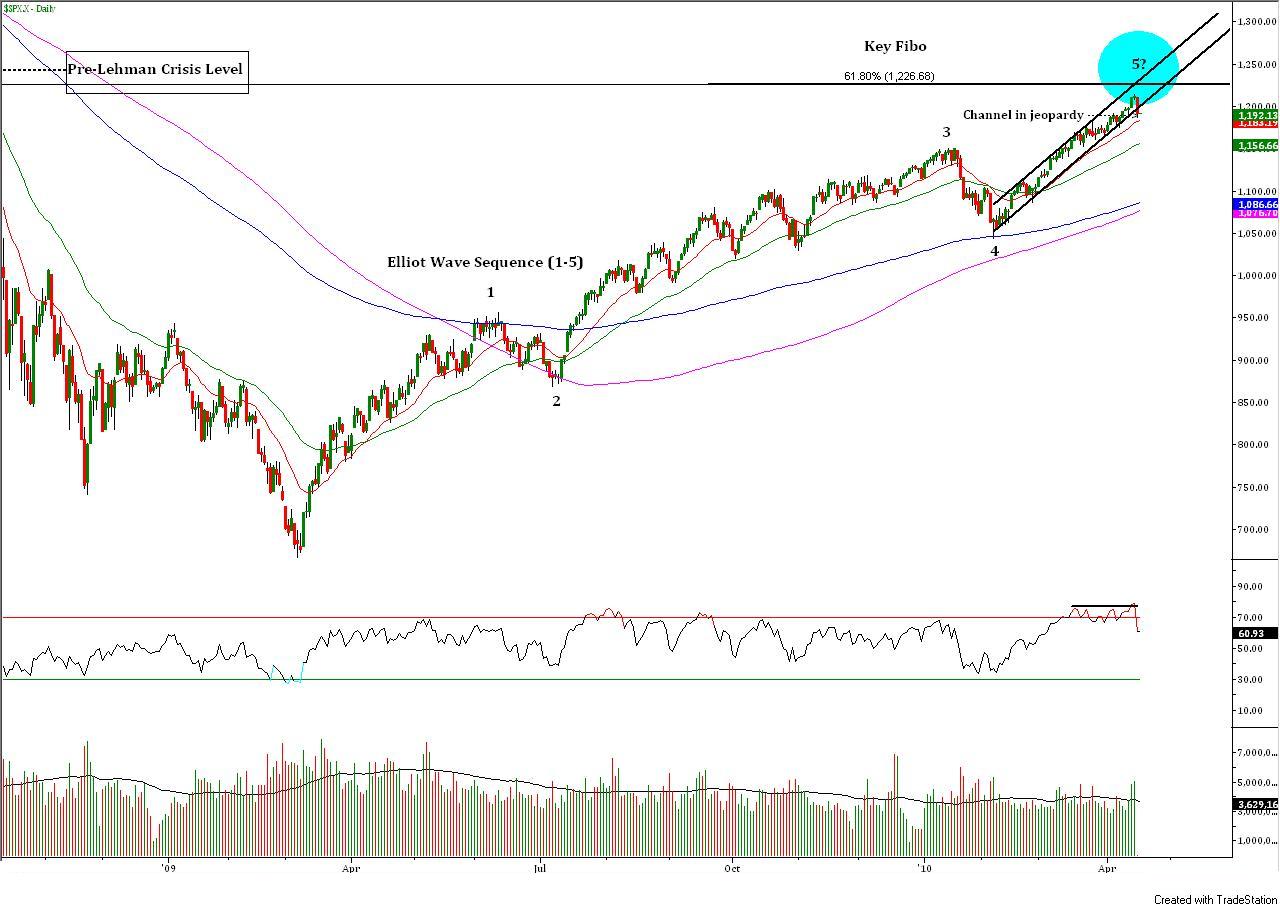
The technical landscape of the major indices further supports the timing of these significant readings in sentiment. These bullets are for the S&P 500 Cash Index:
- Completion of a classic Elliot Wave pattern (3 Impulsive and 2 Corrective waves)
- 61.8% Fibonacci retracement level going back to the 2007 peak looms just above our heads at 1226.
- Retracement back to the pre-panic selling level surrounding the Lehman debacle. Often times panic moves, regardless of the time frame, will at some point be fully retraced. This seems to be largely due to the fact that these moves are on the heels of irrational behavior acting similarly to large gaps, a gap in rationality if you will. Why is this bearish? Because, once “filled” it becomes a point of resistance. (Same rules apply to parabolic moves and the subsequent crash-n-burn.)
On a longer term basis we will still need to be patient and see how events unfold heading into summer before further developing a longer term thesis. If it is a significant trend change we are looking at it will be a bit tricky. Market tops tend to be more difficult to identify than bottoms due to the fact that they are processes and not events. What sometimes looks like a top can eventually turn out to be a continuation pattern. Remember, while there is plenty of evidence suggesting we could be on the cusp of forming a long term top, in 2007 it took several months before the change in trend became clear.
Looking out the next 1-2 weeks
Until Friday there had been little to no reprieve for the bears in over two months. The strength of the rally and the ‘ladder-like’ price action in the indices left little reason to be a seller of equities. Friday’s SEC allegations against Goldman Sachs however, looks like a promising catalyst to begin a near term decline and an upstart in trading volatility.
Friday’s action put in what I like to call a “Dagger Day”. This is a day in which the market knifes lower by at least 1.5-2% shortly after reaching a multi-week/month high with a volume ratio heavily skewed in favor of the bears – Friday’s down volume trumped the up volume by a healthy margin of over 12 to 1 and near the lows of the day it was around 20 to 1. Friday’s sell bar also put the channeling “stair-step” rally, which began on February 5th, in serious jeopardy. (See chart above)
For the near term, probability has become skewed in favor of the bears and as such I will be looking to short rallies in Index futures as they begin to stall and fade lower.
Key levels in the S&P 500 Cash Index:
- 1183 – 20 day EMA
- 1172 – 200 period EMA on 60 minute time-frame
- 1156 – 50 day EMA
- 1150 – Jan 19 high/breakout level
- 1143 – 50 day SMA
In conclusion, with the before mentioned sentiment data, chart landscape, and near term headline risk probability favors at least a highly anticipated up-tick in volatility creating more two way trade which is great news for all of us sitting on a trading desk.
Until next time, I wish you all the best of luck trading and remember to be flexible as markets are never wrong, but traders are! If you have any questions or comments feel free to email me at paul@macro-trader.com.

