

The S&P500 mini-futures (ESH5) were fighting their way higher and making a strong attempt at the 2050 overhead resistance area yesterday (Wednesday) afternoon. Then, the European Central Bank announced restrictions on Greek debt, and the US equity futures dumped 20 points in about 30 minutes.
The futures closed at 2030, five points below the opening price, and a day that had been all green closed all red. The ESH5 contract traded as low at 2022 in overnight trading.
Technically the ECB removed a waiver that had allowed Greek banks to issue debt, even though they do not meet technical capital requirements. The effect is to tighten the screws on the Greek banking system in advance of a Feb. 28 deadline for a resolution of the Greek debt crisis.
Why this should have an immediate and dramatic impact on US equity markets is not clear. Monday the Financial Times printed a story suggesting (incorrectly, we believe) that the new Greek government was softening its negotiating position. The market roared up. Wednesday, the ECB issued a press release hardening its negotiating position and the market dumps.
The external events look to us like excuses for sharp movements, rather than reasons. The market suddenly trends up or down because the herd stampedes in one direction or the other; the “news” provides a rationale but not an explanation.
What Happens Next
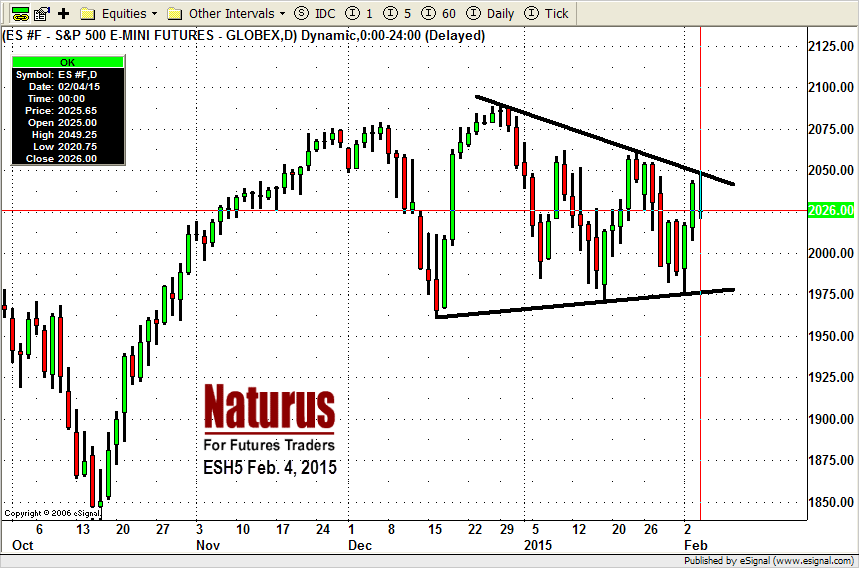
The chart of the ESH5 is showing a fairly well-defined wedge pattern. So far, the up and down stampeding is remaining within that pattern. Until we see some substantial breach of that wedge, we will be discounting the importance of daily moves on the long-term direction.
For the short-term, the fluctuations within that wedge provide excellent trading opportunities.
For today (Thursday, Feb. 5), we should see a further pull back down toward 2018.50-17 to test the brutal short squeeze/rally from Monday. A failure to hold above the 2016.50 line could lead ESH5 to fall more toward the 2009-07 zone.
But later the price is likely to bounce back up. ESH5 may try one more time to rally up to yesterday’s high area, but 2050 will remain a key resistance line.
Support: 2007-09.50, 1988-86, 1975-74, 1968-66.50, 1953-55
Resistance: 2046-43.50, 2056.50-57.50, 2062.50-64.50
ESH5 Daily Chart Feb. 4, 2015
#####
Naturus.com publishes a free analysis of US equity markets each Sunday. To start receiving it,click this link.

