

The S&P500 mini-futures (ESH5) are starting to show the kind of volatile price swings that make experienced traders think the market is reaching a major inflection point.
In the last three trading days, the ESH5 closed at 2018 on Thursday (Jan. 29); at 1988.50 on Friday (Jan. 30); and at 2012.50 yesterday (Feb. 2). The daily range for those three days totaled about 115 points. The net difference in price – minus six points.
The market is thrashing around, not really going anywhere but making lots of waves.
Yesterday (Monday) opened up a little from Friday’s heavy losses, dropped 20 points right off the open, bounced 30 points, dropped 20 points, and bounced back 30 points into the close on the strength of a story in the Financial Times claiming Greece was now willing to negotiate its debt repayment/bailout. (The FT story is being picked apart, and may not stand up, but it has already accomplished its purpose).
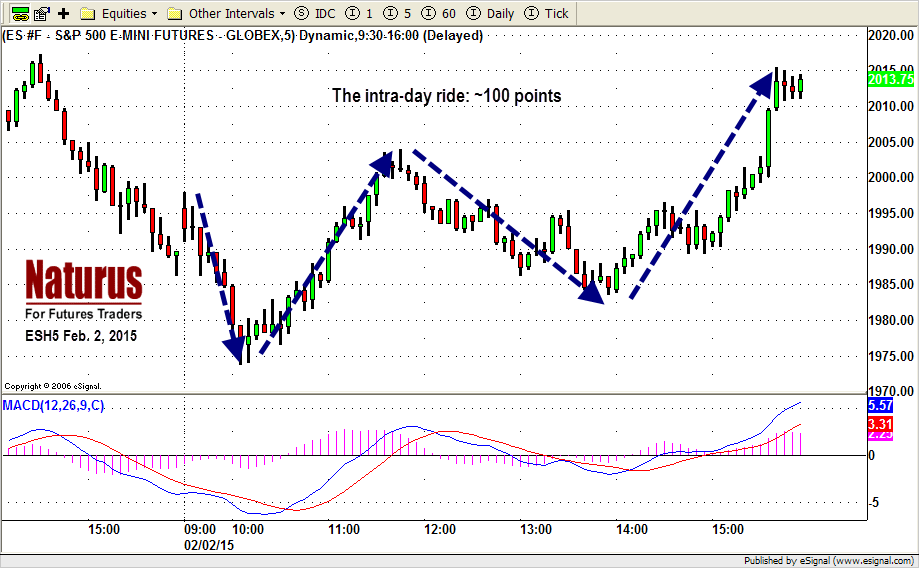
If you want a dictionary definition of indecision, just look at the intraday chart (below). The market travelled 100 points during the session, and ended up just a little below where it was Thursday night.
The price action was bullish, but volume was lighter than Friday’s down-day volume.
What Happens Today?
Who knows? There is a lot of big money with a vested interest in keeping this market elevated, but it is clearly getting harder and harder to keep the bubble afloat. This is shaping up as closer battle than the Super Bowl and, at this point, we can’t pick a winner.
We changed from short-term neutral to short-term Bearish yesterday. Today we’re short-term neutral again. Longer-term, we are still Bullish.
For short-term traders, those epic intra-day price swings are all opportunities, regardless of who eventually wins.
For Tuesday, Feb. 3, we expect more intra-day volatility. There is a resistance area around 2023-26.50, which could stall any further rally; however, if the Bulls push the price above 2028.50, we could see a move back up to 2050.
The first area to watch will be 2009. A break below that level could lead the ESH5 back down to retest 1998.50, or perhaps further to 1988-87.50. And we expect to see more buying on the dips today.
Support: 1968-66.50, 1953-55, 1937-35.50, 1921.75-23
Resistance: 2031-28.50, 2046-43.50,2056.50-57.50,2062.50-64.50
ESH5 Intraday trading Feb. 2, 2015
#####
Naturus.com publishes a free analysis of US equity markets each Sunday. To start receiving it,click this link.

