

Yesterday
The S&P500 mini-futures (ESH5) closed at 2099.75 yesterday (Mar. 5), essentially flat for the day, but slightly above the previous close (2096.50), breaking a two-day streak of marginally losing days. The volume was slightly above the average for recent weeks, and the daily range was very narrow.
The market opened the regular trading session two ticks above 2100 and closed one tick below it, continuing the dance around 2100 that has continued for much of the last 10 days.
The futures made an inside day, which means all of yesterday’s price movement was contained within the previous day’s range. That is typically a sign of indecision in the market, especially when the day’s trading forms a small doji as it did yesterday. It often leads to explosive price swings, and we may see some of that today, after the non-farm payroll number are released in the pre-market session.
Nothing much happened on Thursday; we expect Friday to be different.
Today
The non-farm payroll report coming out at 8:30 a.m. EST is probably going to evoke a fairly volatile reaction from the market. The futures have open gaps at 2104.75 and 2114.50, and there is a fair chance one or both could be filled today.
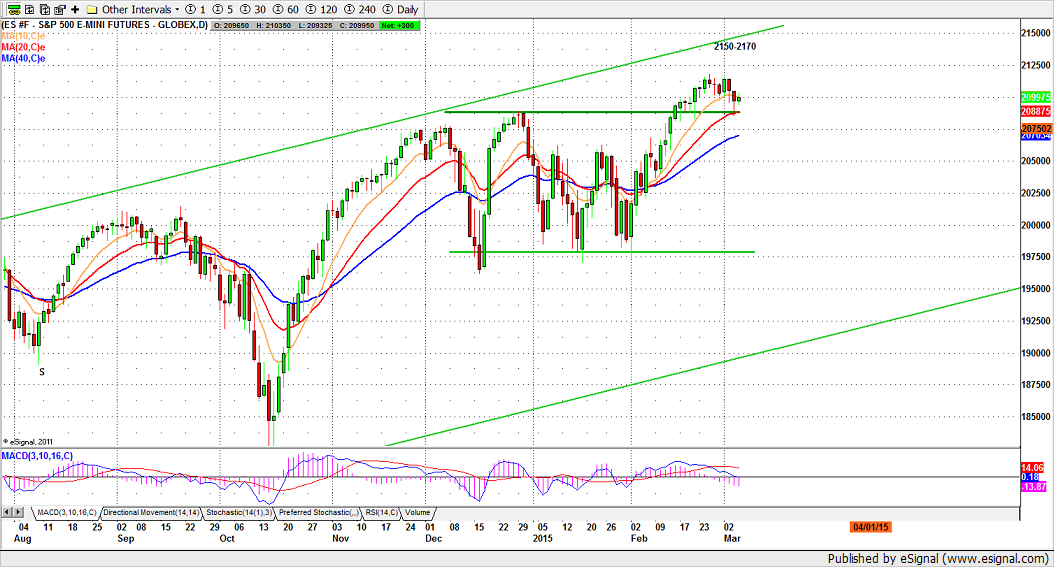
But there is also a decent chance the market could move back down to re-test the support around 2085 – the breakout point for the latest rally and last year’s high (see chart below) – or perhaps lower to 2075-78.
2088.75-84.75 is a broken resistance zone which has now turned into the current key support area. As long as ES closes above this zone, the short-term uptrend remains intact. But a close below 2070 level will be bearish for next week.
A lot depends on the actual results of the non-farm payroll report. The ADP employment report earlier in the week was a disappointment, but the market is in one of those silly stages where bad results from the real economy are regarded as good for the market, since that might persuade the Fed to stall on raising interest rates. Yes, it’s dumb, but that’s what has been happening lately.
Keep in mind, these daily swings are important to us, because we trade them, but they usually don’t have much impact on the longer-term trend. We remain bullish for the medium and long term.
- Major support levels: 2085-81.50, 2065-68.50, 2056.50-54
- Major resistance levels: 2118.50-19.50, 2123.50-21.75, 2128.50-29.50
ESH5 Daily Chart, Mar. 5, 2015
#####
Naturus.com publishes a free weekly analysis of US equity indices. To get on the mailing list , please click here.

