

Yesterday
The market was on the way down in overnight trading and right after the open, before a strong support area and a “soft” intervention from the Federal Reserve reversed the decline. The S&P 500 futures (ESH5) still ended the day down 8.50 points, but it could easily have been much worse.
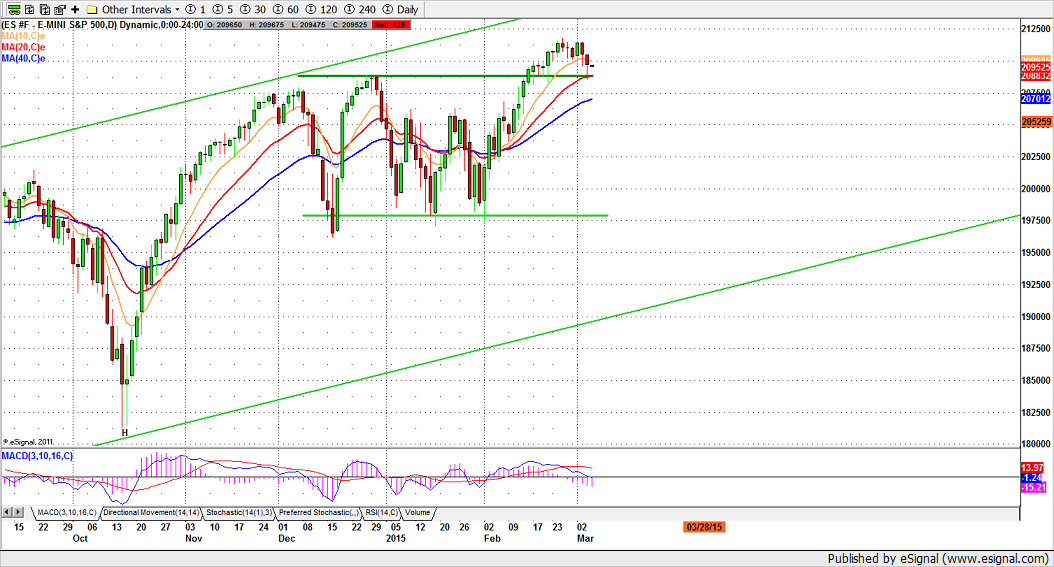
The decline began overnight, when European traders were perhaps anticipating a bad number for the ADP payroll report released in the pre-market session, and continued for the first hour, when the futures bottomed out at 1985.25, our support level and last year’s high (see chart below).
In fact, the ADP number was worse than expected, but not disastrous, and the previous two months were revised upward by a substantial amount. The market reversed at the support level and started to recover.
The recovery got a nice boost from remarks by Dallas Fed President Charles Evans, who publicly called for the Fed to delay any interest rate hikes until 2016. Of course, this was also a reminder that the Fed has hinted that it will raise rates as early as June, if not sooner. We get the feeling that the Fed jawboning has already been priced into this market.
The ESH5 closed at 2095.50 on slightly higher than average volume. There was a substantial amount of down volume in the first hour of the regular trading session.
Today
For Mar. 5, we could see a small bounce if 2085.25 continues to hold the market up during overnight trading, but we don’t expect this bounce to amount to much. It looks to us like the shorts covering ahead of tomorrow’s Non-farm payrolls.
- 2115.50-18 could be the top area for this week; 2095.50 is today’s key line.
Remaining under the key line will be negative and the price is then likely to drop back to yesterday’s low or lower to the 2080.50-76.50 zone (long entry).
A break above 2102.50 could lead the ES to fill the 2104.75 gap or move further up to 2107.50-09.50 if the buying is strong.
- Major support levels: 2085-81.50, 2065-68.50, 2056.50-54
- Major resistance levels: 2118.50-19.50, 2123.50-21.75, 2128.50-29.50
ESH5 Daily chart, March 5, 2015
#####
Naturus.com publishes a free weekly analysis of US equity indices. To get on the mailing list, please click here.

