

Yesterday
The ESM5 closed at 2059.25 on Tuesday, down 15 points for the day. Trading was briefly halted in many S&P 500 Sector ETFs and in the VIX ETF at the beginning of the day session.
We promised volatility for the S&P 500 mini-futures yesterday (Mar. 31) and volatile it certainly was. After rallying 50 points in three trading days – with much of the ramp coming after-hours, when the volume was negligible – the ESM5 completed the round trip Tuesday. It gave back two-thirds of the gain in the day session, and then tanked another 15 points in the early after-hours trading on rumors – so far unconfirmed – that the Iran nuclear talks have failed.
At the close, the futures were showing a gain of 0.04% for the year to date. If the market doesn’t recover overnight, we will be in the red for 2015 by the time New York opens in the morning.
Today
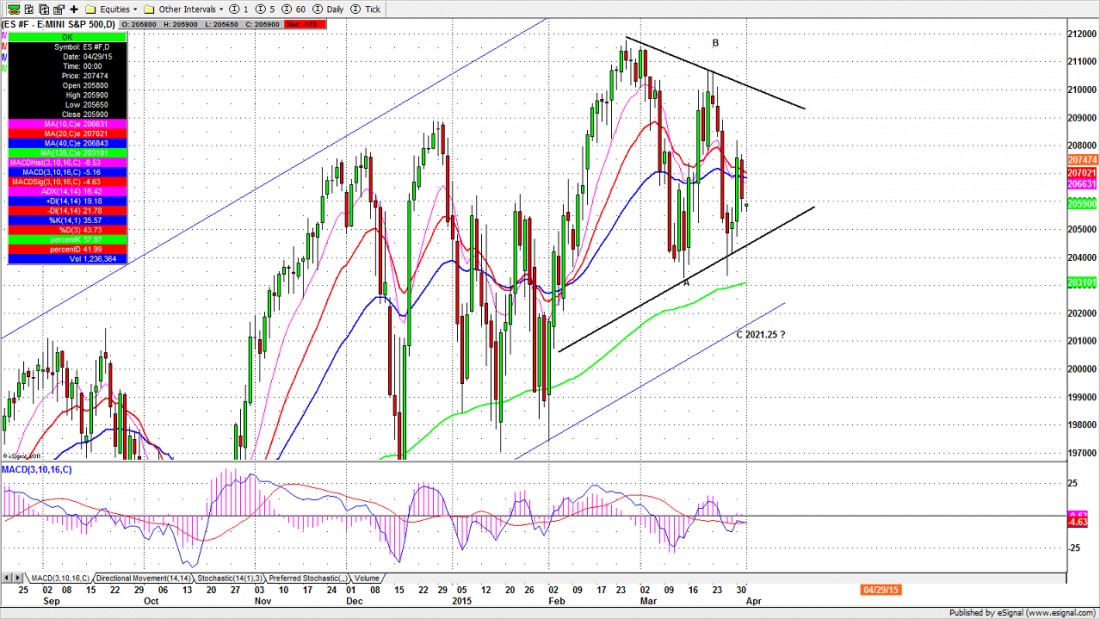
The normally bullish sentiment at the beginning of the month may hold ESM5 above the 2052.50 level for an extra two days until next Monday. But the short-term triangle pattern on the daily chart (below) really needs to be watched. A break below 2045 will lead ES to head toward the 2030-2020 zone to complete the A-B-C correction pattern.
2085-2075 should be the major resistance zone for the short term. A move above 2085 could push the price back up to 2090-94.75, which could eliminate any downside move to the 2030-20 zone.
But if the futures fail to break through 2066.50 today, a further decline toward 2042.50-46.50 or lower toward 2035-36.50 should be expected. The short-term outlook for ESM5 is not bullish, and any rally should be short-lived.
- Major support levels: 2045-43.25, 2035.50-33.50, 2028-29, 2015.50-14.50
- Major resistance levels: 2078-79.50, 2088.75-89.50, 2096-98.50
ESM5 Daily Chart, Mar. 31, 2015
 #####
#####
Naturus.com publishes a free weekly analysis of US equity indices. To get on the mailing list, please click here.

