

Yesterday
The S&P 500 mini futures (ESM5) closed up 9.75 points yesterday, a 0.5% gain that may give a hint about the direction of the next market move.
The futures dropped to the low of the day in the morning session, but marched boldly back all afternoon and closed at 2085.75, near the high of the day, on decent volume. The 20- and 40-day EMA lines overlap and acted as a strong support line to push the price back up.
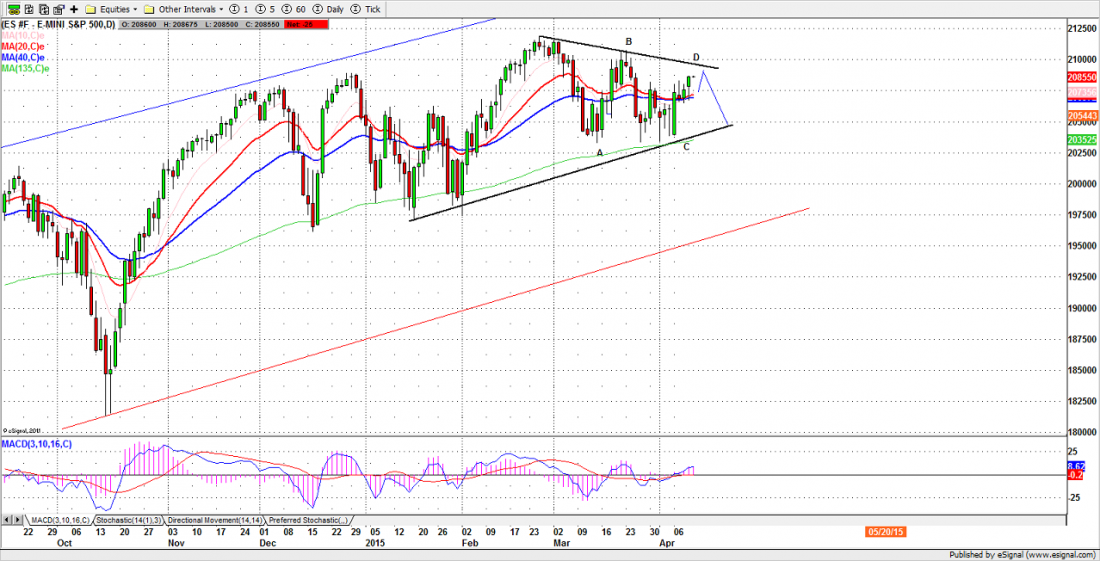
Earlier this week, we were discussing the wedge triangle developing on the daily chart and the way the movement into the narrow end of the triangle is creating a congestion area that will lead – eventually – to a solid break out. We just can’t tell what direction it will take.
Yesterday’s price action, which was bullish, makes us start to favor a move toward the D destination on the chart, and that area is becoming a key to determine whether the next move should be to the upside and a new high, or a pullback to form an E low within the broad “wedge” pattern.
Today
The 2097-2100 zone should be the D top area. A move above 2102 level and a close above it today – in effect a break out – will breach the “wedge” pattern and probably lead to higher highs in the following week.
Remaining under 2097-2100 could leave the ES around Thursday’s high 2087, or move it lower to the 2078-75 zone.
The 2071-69 zone could be today’s major support. As long as this support zone holds up, odds will favor the upside. Also the lowest low made today or yesterday could be the low for next week, which is the major option expiration week for April.
- Major support levels: 2062.50-64.50, 2055-56.50, 2045-43.25, 2035.50-33.50
- Major resistance levels: 2088.75-89.50, 2096-98.50, 2107.50-05.50
ESM5 Daily Chart – Apr. 9 2015
#####
Naturus.com publishes a free weekly analysis of US equity indices. To get on the mailing list to receive it, please click here.

