

In late March and early April I wrote about buying the dip in SPY (S&P 500 Depository Receipts). Since then a period of consolidation evolved into what I call a Flim Flam chart pattern, and yesterday’s rally suggests a breakout may be underway. I first observed this pattern back in my S&P days and saw it recur enough times to consider it a reliable trading pattern. Here’s how it works.
To summarize, the pattern consists of two periods of consolidation cut through the middle by fake outs both higher and lower. I call it a Flim Flam because buyers lose and then short sellers lose before trend followers with a longer time horizon are rewarded. It ends up being a case in which a pause in an uptrend takes longer than the crowd anticipates, and there’s a sloppy tug-of-war as it evolves.
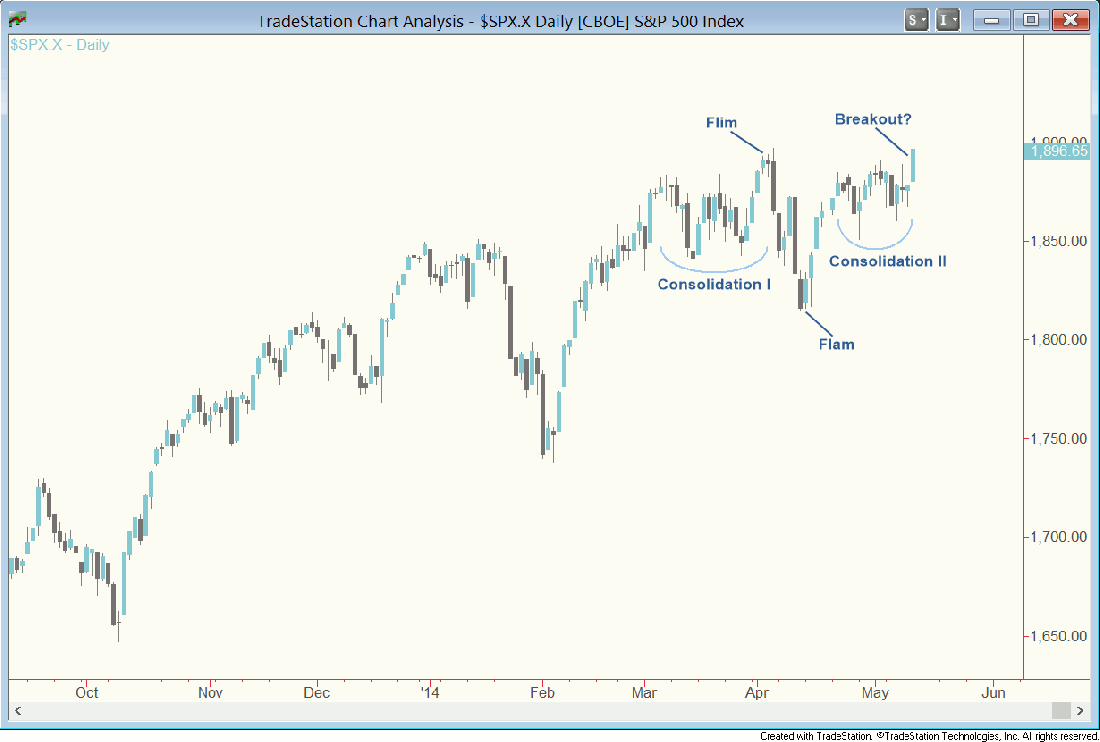
I believe the psychology behind the pattern is this. First, the crowd buys into a consolidation, causing a breakout. The breakout fails because, for whatever reason, demand isn’t strong enough; the uptrend is in need of a longer rest. Second, the lack of follow-through buying at a natural place to expect it leads to a bout of panic selling that culminates in a breakdown. Third, that breakdown ends up attracting dip-buying that brings the market back up to where it had been trading. Finally, price moves into a second period of consolidation and goes on to break higher, extending the larger uptrend.
Keep in mind this rather granular explanation of my take on the mechanics of what merely amounts to a particular type of pause in an uptrend. That said, in trading, sometimes the devil is in the details, and if you can identify them, you’ll find excellent opportunities.
Good trading, everyone.

