

The iShares Brazil ETF (EWZ) has had a great run off its February low, gaining 30% in just a couple months. However, with its attempt at a new high in June some storm clouds have begun to gather over the host of the World Cup.
In April we saw the RSI momentum indicator break above, and stay above, the ‘overbought’ level of 70 and we also saw a kiss of 70 in May. But with this latest advance momentum has begun to weaken – creating a negative divergence with price. When we begin to see momentum via the RSI indicator make lower highs as price hits a prior high a yellow flag goes up that the current uptrend may be in danger.
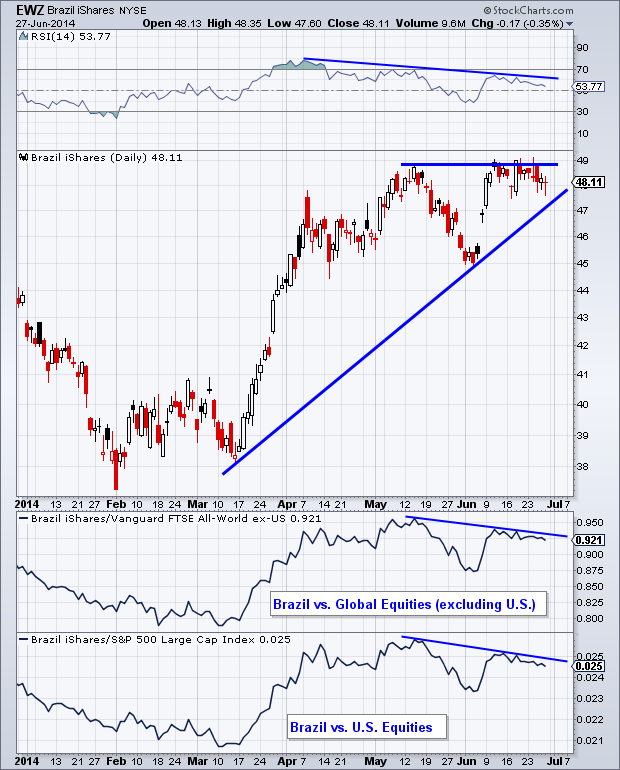
Looking at the relative performance against global equities (excluding U.S.) and against the S&P 500, Brazil has created lower highs in both relative performance charts (shown in the bottom two panels of the chart). This is a sign that things may not be as on fire as they were in the massive jump that took place earlier this year.
Key Levels
If EWZ is unable to break its current double top at $49 then I’ll be watching to see if price is able to hold its rising trend line right around $47. We can also use the previous low in the RSI indicator as a potential sign of support on any future weakness. If the momentum indicator drops down to 39 I’ll be looking to see if this level can act as support.
Disclaimer: The information contained in this article should not be construed as investment advice, research, or an offer to buy or sell securities. Everything written here is meant for educational and entertainment purposes only. I or my affiliates may hold positions in securities mentioned.

