

While U.S. equities and emerging markets are full steam ahead, our northern neighbors seem to be hitting some roadblocks. The iShares Canada ETF (EWC) has been underperforming the S&P 500 for the better part of 2013, with a slight uptick in August.
MARKET ANALYSIS
Since March, EWC has been finding resistance at the $28.30 level. If the selling persistence then we can see the rising trend line off the June and August lows could provide a level of support for EWC. It’s interesting to note that at each run up to $28.30 we haven’t seen momentum rocket higher. Only for a brief movement in July did we see the Relative Strength Index break into ‘overbought’ territory, only to retreat the following day.
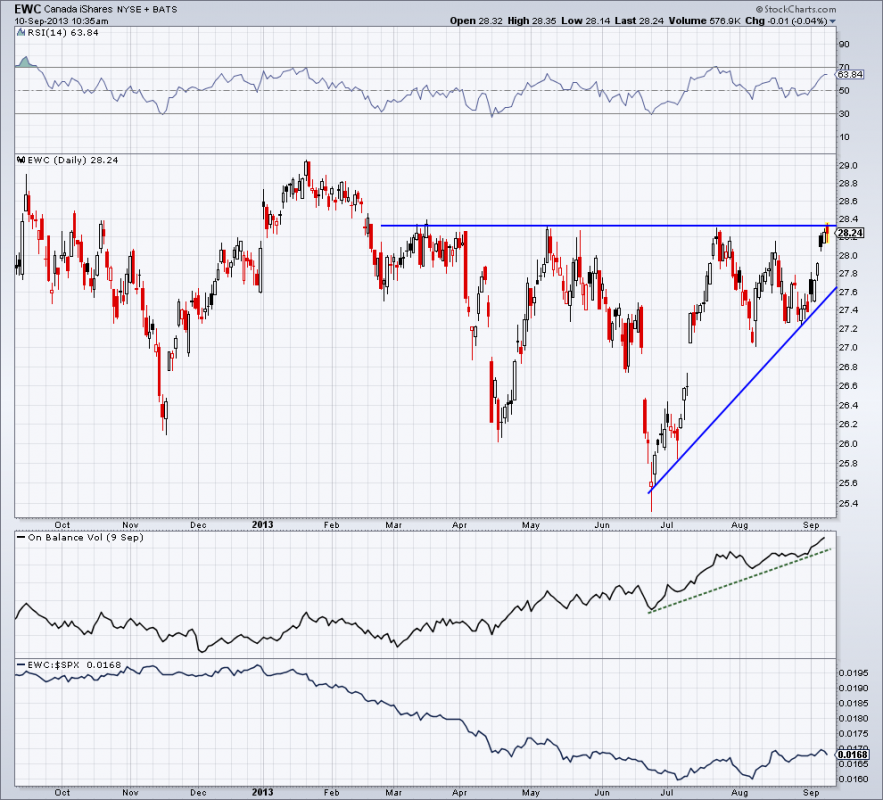
The Canadian bulls will point out that the RSI indicator is still within a bullish range as it finds support near 40 in August during the period of price weakness. They would also note the subtle accumulation that can be found in the On Balance Volume (OBV) indicator in the third panel of the chart. While price has been bumping up against the above mentioned resistance, volume on positive days has been outpacing the selling pressure on down days for EWC as OBV continues to hit new highs.
BURDEN IS ON THE BULLS
We’ll see if buyers are able to step up in force to break above $28.30 and join the U.S. in its romp to higher equity prices.
Disclaimer: The information contained in this article should not be construed as investment advice, research, or an offer to buy or sell securities. Everything written here is meant for educational and entertainment purposes only. I or my affiliates may hold positions in securities mentioned.
= = =
Read another commentary by Thrasher here:

