EURGBP
Hi all. I would like to introduce myself. My name is Ian Coleman and I am a trader and analyst at Turtle Futures. We are a trading firm based in Chelmsford, Essex.
It is our intention to expand our offering to the market, and as such, we have decided to share some of our analysis with you. We are also redeveloping our website at the moment. In the near future you will be able to see all trade recommendations at the site and also trade through our Spread Betting Company, Turtle Index.com.
Here is a taste of things to come.
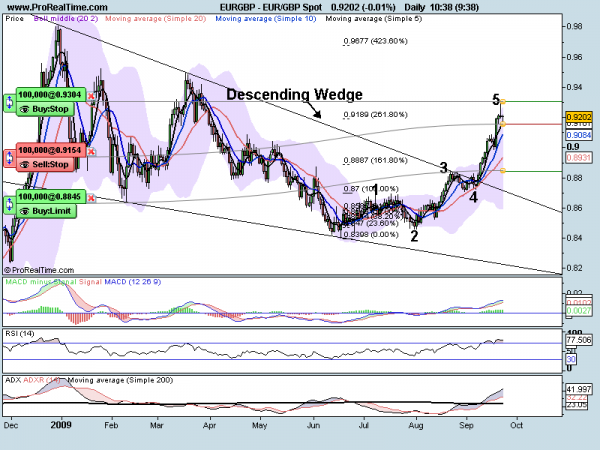
EURGBP Daily
We had a large descending triangle formation that started back in December 2008. We tried to push through higher at the end of August but the trend line held well until the 15th of September. It also had the 20 SMA for support and finally broke. These first wave movements can be counted in a 4 wave sequence (Elliott Wave). As with most wedge break outs, we have then rallied aggressively higher. We broke above the 261.8% extension yesterday (5th wave target) but only to produce a large daily doji. We are trending well on the MACD and have no divergence. We are overbought on the RSI but with the ADX indicator above our trend line (showing a strong trend) this can be invalidated.
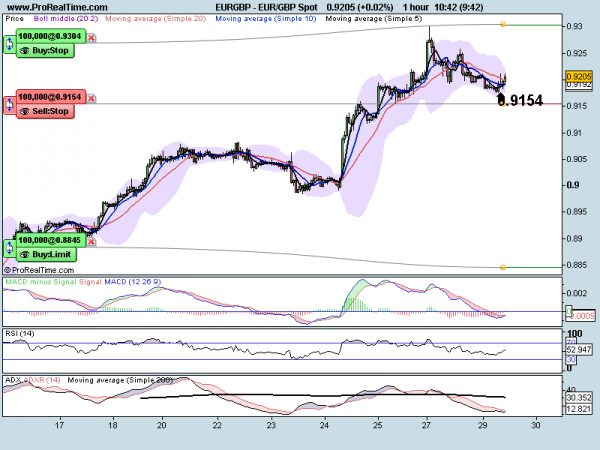
Just because we have a good doji we should not execute a sell trade – yet. We need to look at the 1hr chart.
We have a significant low at 0.9154 (25th Sept). If we break this low then we can look to 0.8845 as our downside target. A break back above 0.9304 would invalidate the call. Risk / Reward 1:2. It should also be note that the potential downside could reach 0.8690, previous resistance, now support.
Good luck.


