

Like many, I’ve been observing the price structure of the S&P 600 Small-cap Index to determine if a top has been evolving since the beginning of the year. Small-caps often peak before the rest of the market because it’s a risky space in which corporate earnings are highly sensitive to the business cycle. The magnitude of the recovery off the mid-October low increases the odds that the sideways trend this year will resolve higher.
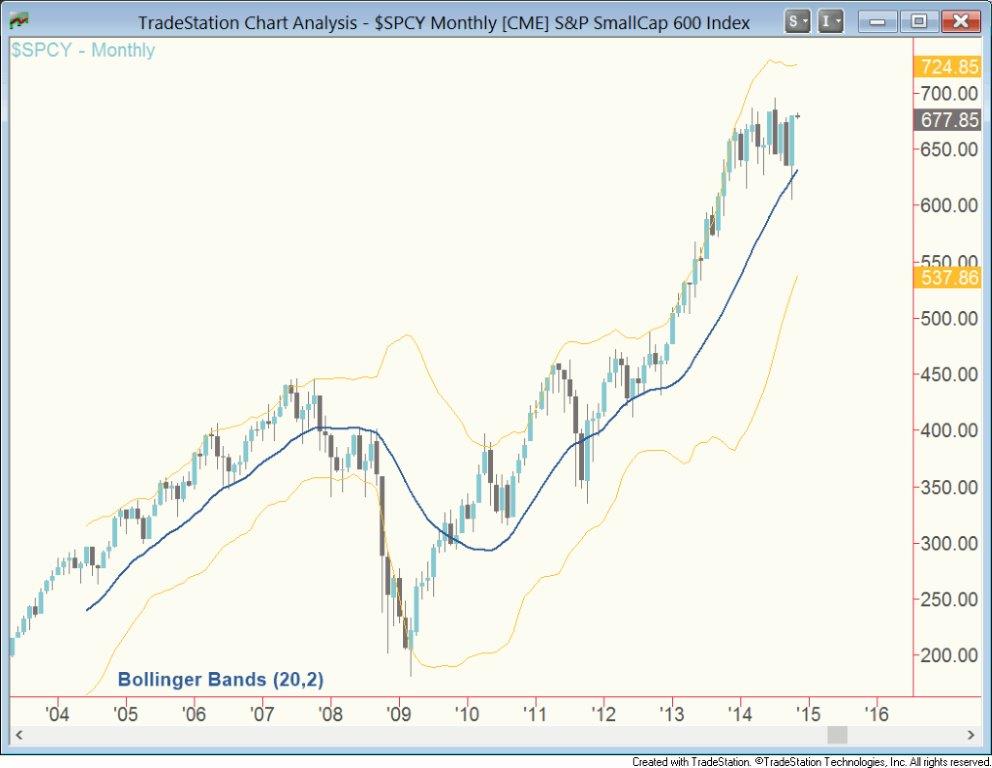
The monthly chart above shows a plain vanilla reversion to the mean – via a consolidation rather than a pullback – that attracted buying. Specifically, after an enormous run in 2013, supply and demand came into balance and the S&P 600 index reverted to the 20-month moving average. The fact that the test of this average attracted buying affirms the primary uptrend.
This is an encouraging sign for the rest of the market, as it shows risk appetite is still strong. Indeed, last week I wrote about the S&P 500 pressing a key technical resistance level and ultimately the index rallied past that point with little trouble. Given the speed, it might be a scary uptrend to chase, but there isn’t any sign of it being over.

