

Tuesday morning we warned that the Fed was going to shake the equity futures markets. Wednesday they shook – and as happens so often, delivered the maximum pain to the maximum number of participants.
For months the Fed had been hinting at plans to “taper” its bond-buying Quantitative Easing program. Most traders were betting on a “tiny taper” – a reduction from bond purchases totaling $85 billion a month to perhaps $70 or$75 billion.
WHAT HAPPENED WEDNESDAY
Then the Fed changed course; the economy was faltering, they decided by a vote of 9 to 1, and reducing Fed stimulus would damage the embryonic recovery. Quantitative Easing stays … quite possibly forever.
The market reaction was immediate. High-frequency trading programs boosted the S&P index ETF (SPY) by three points in 150 milliseconds, a period of time so brief no human person can comprehend it.
The S&P 500 index futures contract, ESZ3, took all of 60 seconds – a decade for the trading bots – to gain 18 points. Gold, oil, bonds, all made substantial gains.
It was a bloodbath for the shorts.
WHAT HAPPENS NEXT
Many analysts think the Fed has painted itself into a corner; they got timid when interest rates on the key 10-year bond started rising (i.e. bond prices falling) and decided to kick the can a little further down the road.
But it has to stop somewhere, and it is harder to stop now than it was on Tuesday.
If even a “tiny taper” is too disruptive, the Fed has to keep on buying bonds, with no end in sight. By some estimates, within a year the Fed will own almost half of all US government treasury bonds, which leaves the biggest bond market in the world with nothing much to sell.
As one commentator noted: “… the endgame is a total collapse. But from a higher diving board.”
TECHNICAL ANALYSIS
The game has changed. The Fed non-taper sent the equity futures to new highs, and what had looked like a bearish double top formation now could develop into a bullish butterfly pattern.
For the short-term the market is severely over-bought, and we could see either sideways range trading or a pull-back to relieve some of that over-bought pressure, especially around the release of the employment data in the pre-market.
Courageous short-term speculators can look for a short entry around 1728. But keep your finger on the trigger; there will be some buy-the-dip action if it looks like a decent pullback is developing, and this week is triple witching, when option and futures contracts expire and volatility increases.
If there is a pullback, we will be watching the support area around 1705. If it holds, it signifies that the up-trend is continuing; our upside targets (see chart) would still be in play.
And if the price does retrace to the 1705-1700 level, we’ll be getting long. Our longer-term bias is still to the upside; after the Wednesday earthquake, we think this old bull can stagger a little higher yet.
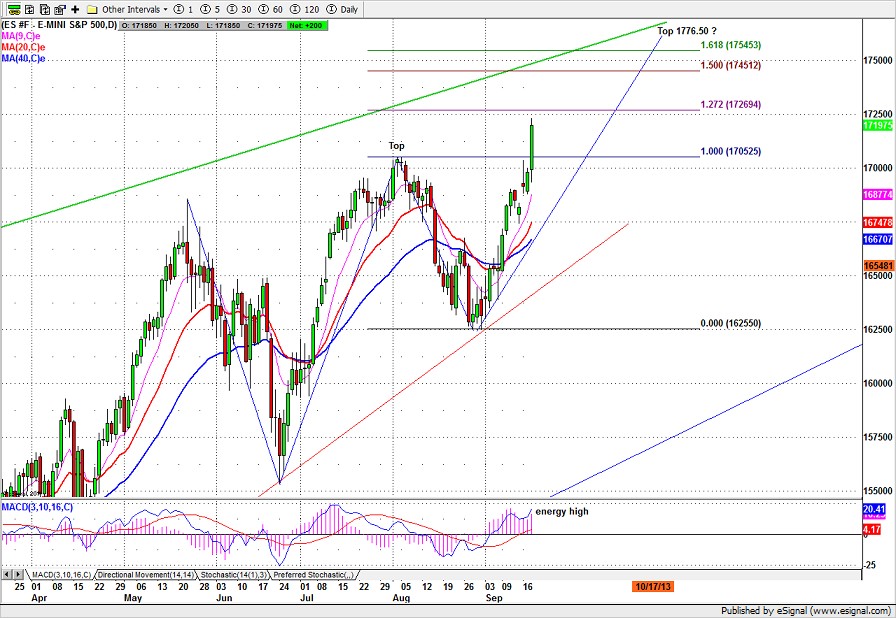
Chart: ESZ3 Daily chart to Sept. 18, 2013
= = =
Polly Dampier is the brains behind www.naturus.com, a subscription service where she gives active traders live, real-time market direction and analysis.
Related commentary:
What The Fed’s Decision Really Means

