Just a reminder, these charts are posted as examples of the trades on the nightly COT Signals email. These trades will help illustrate the mechanics that go into creating the nightly email.
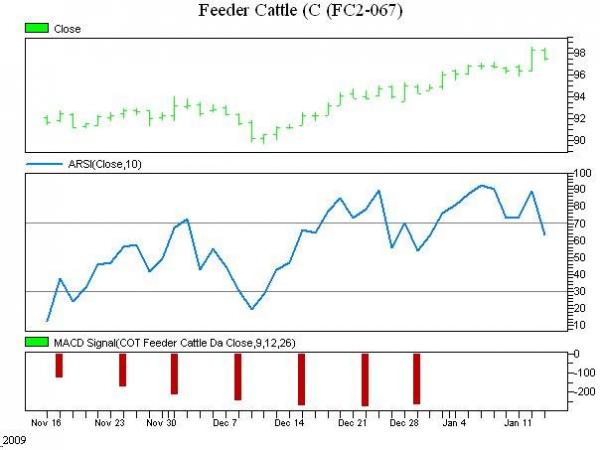
March Feeder Cattle could be running out of steam. Commercial traders seem to think so. This chart shows that they have increased their selling pressure substantially (the red bars in the bottom graph) once the market rallied through the highs around 94.
Furthermore, there is a classic technical divergence between last week’s high around 97.25 and our current swing high of 98.60. The divergence can be seen in the ARSI momentum indicator in the blue, middle graph. Even though the market made higher highs, the momentum indicator failed to reach the previous high. This is typically a sign of a weaker high as the market runs out of gas.
The trade from the worksheet is to sell March Feeder Cattle and place a protective buy stop at the current swing high of 98.60.
Any questions, please call.
866-990-0777


