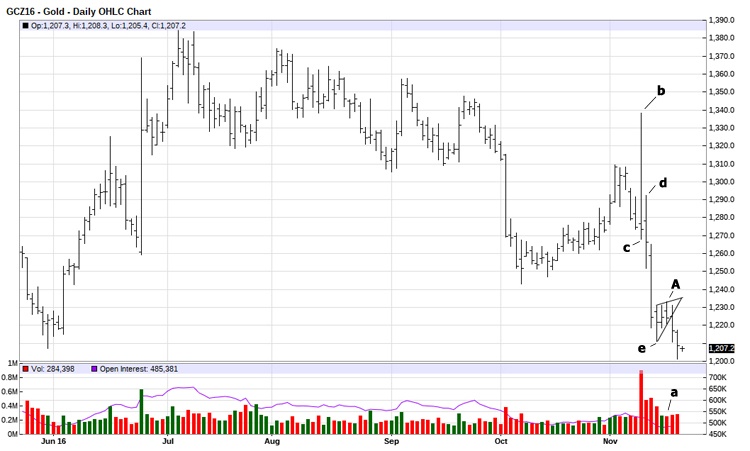
There is a very interesting setup happening on the gold charts. It appears that a flag/pennant formation is developing and suggests lower prices are to come. As you can see, the market has been consolidating in a narrowing range since the beginning of July. This triangular formation is very typical of a continuation pattern. The overall fall in volume since the July price peak, while normal for this time of year, supports my analysis.

Fundamentally, August is a very slow time for the gold market. Many dealers globally are off on vacation (holiday). Few are minding the market and thus the low transaction levels. Still that does not retract from the lower volume validation of the chart pattern.
Because of seasonal physical demand, it is not surprising that this market has been so boring of late. Still, the fact that price has held up well since the beginning of the rally in December supports the idea that gold remains in an intermediate bull market. This is a time of year when the gold price typically bottoms. That is not what we are seeing now. Price is actually accepting higher prices.
In fact, look at the seasonal price chart; this will make your eyes bug out!
We are at a point when, due to the seasonal factors of demand, market fundamentals tend to shift to be very bullish for gold. This is a time when jewelry demand picks up significantly, in order to supply manufacturer’s with materials needed for upcoming holidays and festivals across the globe.
A break out to the upside on the chart formation would signal that a significant up move in price has resumed. The old chartist adage is that the flag flies at half mast. If that is true, the rally from a to b (05/31/16 to 0706/16) was $176.00 ($1386.40 – $1210.40). Add that to the low at c ($1319 on 07/21/16) and we get a projection of $1495 basis the December contract. A secondary indicator that would support my analysis would be to have the ADX (green line) turn up, as it would confirm a new trend has begun. I believe the price of gold is about to move significantly higher. Watch the chart for a breakout.


