In parts 1 and 2 of this series of commentaries I explained how George Lindsay’s Three Peaks and a Domed House forecast the top of the bull market on October 5, 2012 and the minimum price forecast for a low to the current bear market. In this article I want to explain how to make a preliminary forecast for a low to the bear market based on what we know now.
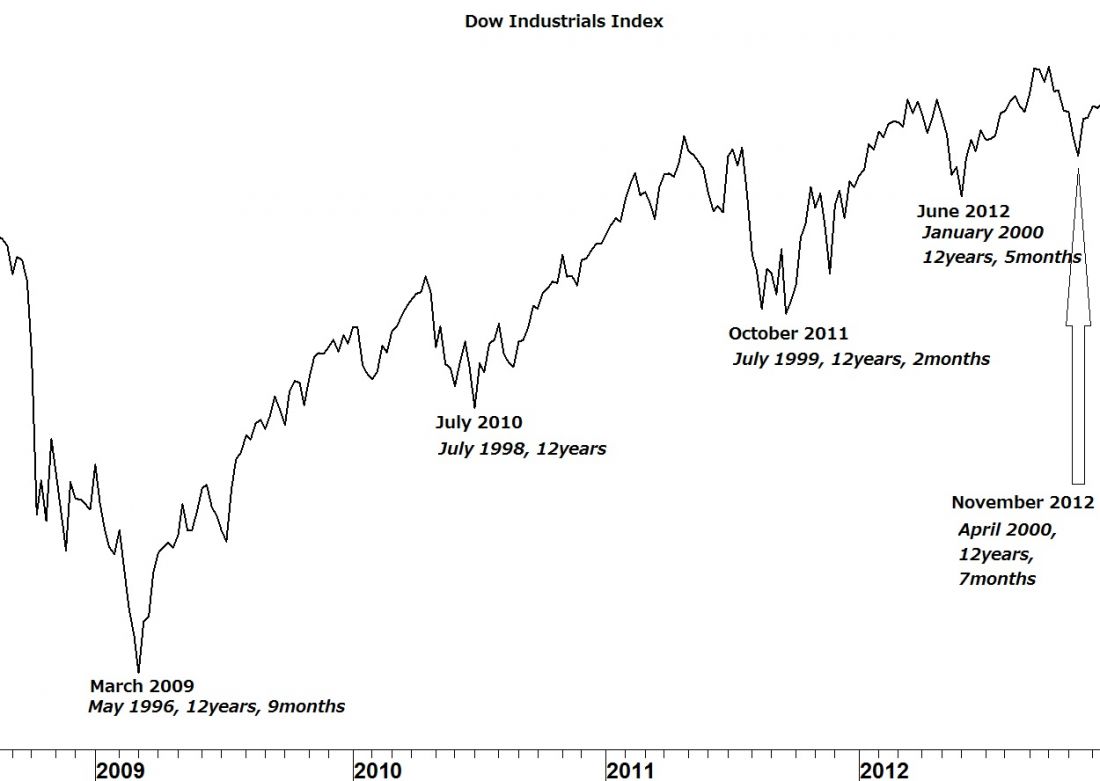
The first step in forecasting bull market highs and bear market lows is always the long-term intervals. Highs are found using Lindsay’s 15-year interval and lows are found using his 12-year interval. To be more specific, lows are found in a time range of 12years, 2months to 12years, 8months from an important high. Once these ranges are established, we can then narrow them down using Lindsay’s other models.
The first chart below shows the important highs of 1996-2000. You may be thinking there are other highs that could have served as “important highs” during this period.
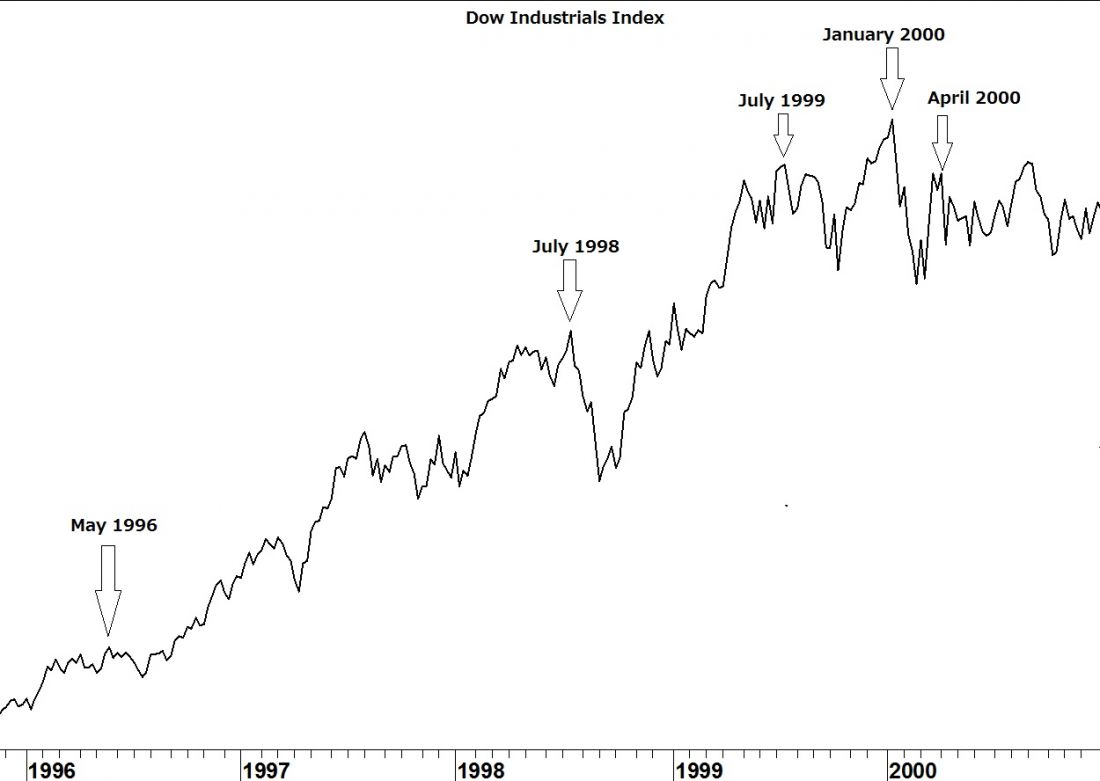
This is a good example of why no single model of Lindsay’s can be used in isolation. The complete system is like a crossword puzzle. We can’t assume that just because a word in the horizontal line fits that it will work with a word in the intersecting vertical line. Those highs in 1997 didn’t work with Lindsay’s other models.
Now look at the next chart and see how those lows are counted from the important highs above. They all fit within the time frame of 12years, 2months to 12years, 8months with the exception of the July 2010 low. Again, we can’t be successful using any model in isolation but it was close. I’ll be back next week and will identify the next important high and low then. In the meantime, you can try identifying it yourself.