

Excited to kick off trading for the New Year. To start off, we are looking at the Aussie/dollar (AUD/USD) daily chart, a currency pair which has been on my ‘radar’ during the last couple of weeks.
Why? Well because the AUD/USD is currently testing a weekly support level, and whenever a weekly support or resistance level is being tested, that chart will have my full attention.
Weekly levels are the major turning points in the market. If you haven’t been watching them, I strongly suggest you do. Because these weekly levels are where major price action events take place. Events like trend reversals and even powerful long term containment breakouts.
The AUD/USD has bottomed out on strong weekly support, actually triple bottoming. Each time the support level was tested it prompted a strong bullish reaction from the market. The last test of support created an indecision candle, which is one of our breakout setups. The indecision breakout trade triggered last week, but the market did close with a display of hesitation to move higher, note the long upper wick on the previous candle.
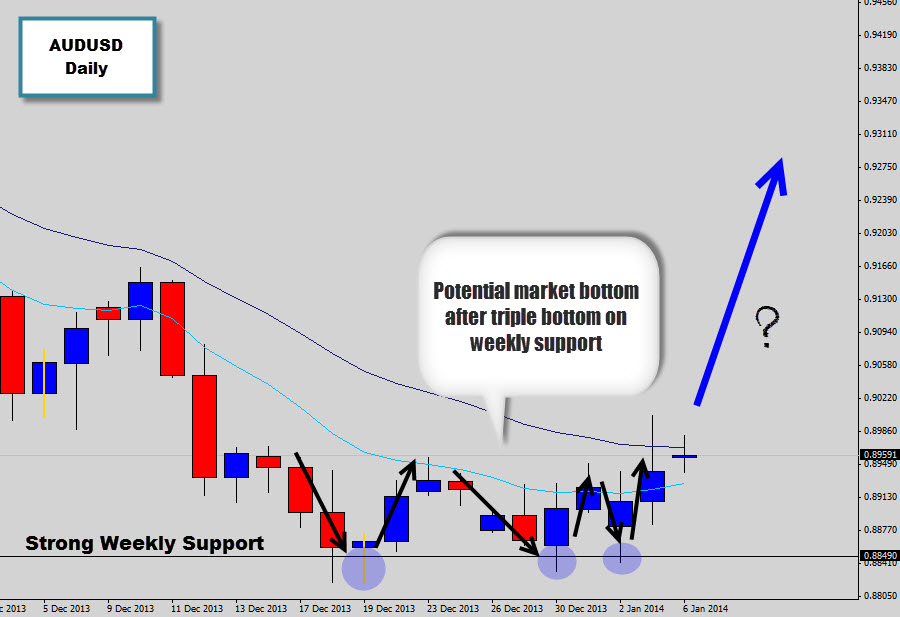
I’ve seen this pattern before, initial resistance to price trying to breakout off a weekly level. Usually the market will soak up the pressure as the bull take control – in this case.
Looking out for further bullish price action signals to get us in with any developing bullish momentum. If the weekly support doesn’t hold, we could be looking at more serious downward movement for the Aussie.
= = =
Join us on our Facebook page. We’d love to hear from you!

