

“Any deviation in simplicity results in a lack of dignity”
San Diego Architect, Irving Gill
Trading is a fairly simple activity. If price is going up, it’s best to buy. If price is going down, you should probably sell.
USE YOUR INTUITION
The way we decide which way price is going can be trickier. But, charts constantly give us hints. I’ve always considered technical trading fairly intuitive. If a level holds it’s important, if it breaks, look for it to still be important. Then all we have to do is figure out how to get in or out of the market.
Over the last few weeks, we’ve looked at using stochastic crossovers, and support and resistance to enter trends in the direction of the trend. We looked at regression trend channels to identify swing changes. Now let’s spend a little time and put a few things together.
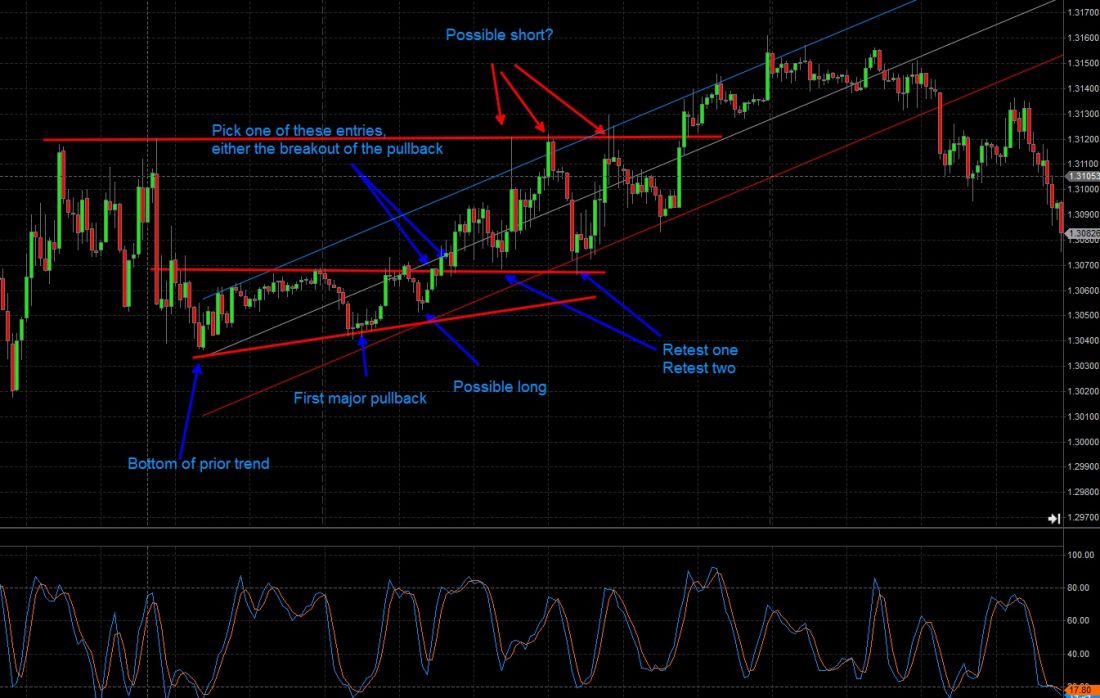
See Figure 1 below of the euro/dollar. The first thing to notice is the regression channel encompasses the entire trend. Obviously it didn’t start that way; we adjusted it as price moved along. The great thing about this tool is how fluid it is to use. Spend some time and throw this tool up on a few charts. Maybe even use the same time period I’ve been using and play with it. Using the instructions I gave last week, connect the low from the initial bottom we identified to the low from the first major pullback. After that, notice price never closes below the bottom ascending line. Next, adjust the line each time price closes above the center line. Pretty cool huh?
GETTING IN AND OUT
Now, that gives us an idea of the trend, but we still need to pick entries and exits. That’s where support resistance and the stochastics come in. If I’d been watching things, I probably would have gone long where I labeled “possible long.” This isn’t a great trade. The stochastic crosses long, price stopped on a fib support but it’s also about an hour before the European open where price tends to consolidate and we have yet to see a breakout. But if you’re ok with targeting prior highs for a few pips, it isn’t a bad trade. Remember, at this point, price could have gone down just as easily as up.
The next entry is fantastic. Right around the European open, price breaks to the north. Next week I’ll talk a little regarding the risks around trading right at the open. But for now, all you need to know is this is when liquidity starts to flood into the markets. Once the upper resistance breaks and closes up there, jump in, or wait for a retest of the area. Notice price retests that area twice more before continuing long. Remember, there’s nothing wrong with taking profit a few times if you’re day trading. You might even want to short off those highs. That area had been used for resistance in the past. If you do that, be careful though. So long as price is near a reasonable area where you can define your risk, and you have a reasonable expectation of an area holding or breaking, you can trade. Remember, some trades are better than others though.
= = =
Read the Night Owl Trade here for overnight forex plays.

