
As I have been saying on this blog, I believe there is going to be a considerable short squeeze in silver. Since my last post, we have started to see the price action slowly confirming that a possible bottom could be in place in the silver market. Lower prices are always possible, but I believe that the bears are running out of time. Lets have a look at what the charts have to say.
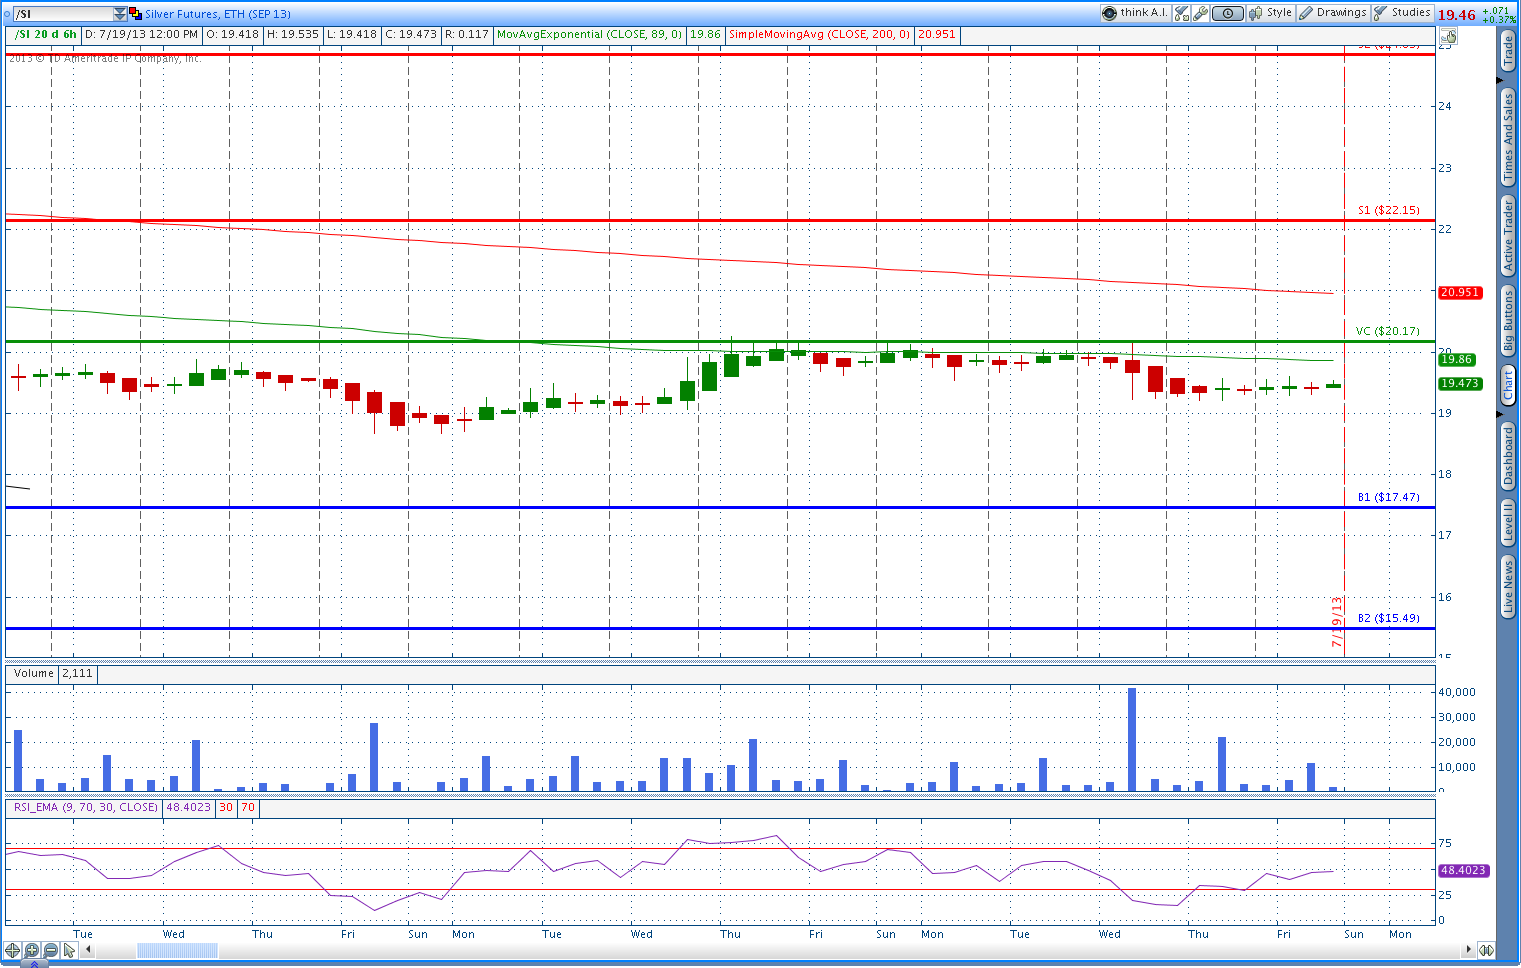
The chart above is The VC Price Momentum Indicator being applied on a monthly time frame. These numbers were given to me July 1st. It is obvious that on a monthly timeframe silver has encountered its first area of resistance @ 20.17. This VC number indicates that price action in silver has currently been neutralized for the month of July, as silver has flirted with the VC number for the majority of the month. If we are going to get anything going in silver for the month of July, silver would need to take out 20.17 on a closing basis on the 6 hour chart. As far as downside risk is concerned, 17.47 and 15.49 are reflective at the B1 and B2. If those numbers were to come in, I would expect a tremendous amount of short covering there. As is stands now, however, it appears silver has not given us confirmation on the VC Monthly Chart. The weekly chart, however is starting to confirm a bottom forming.
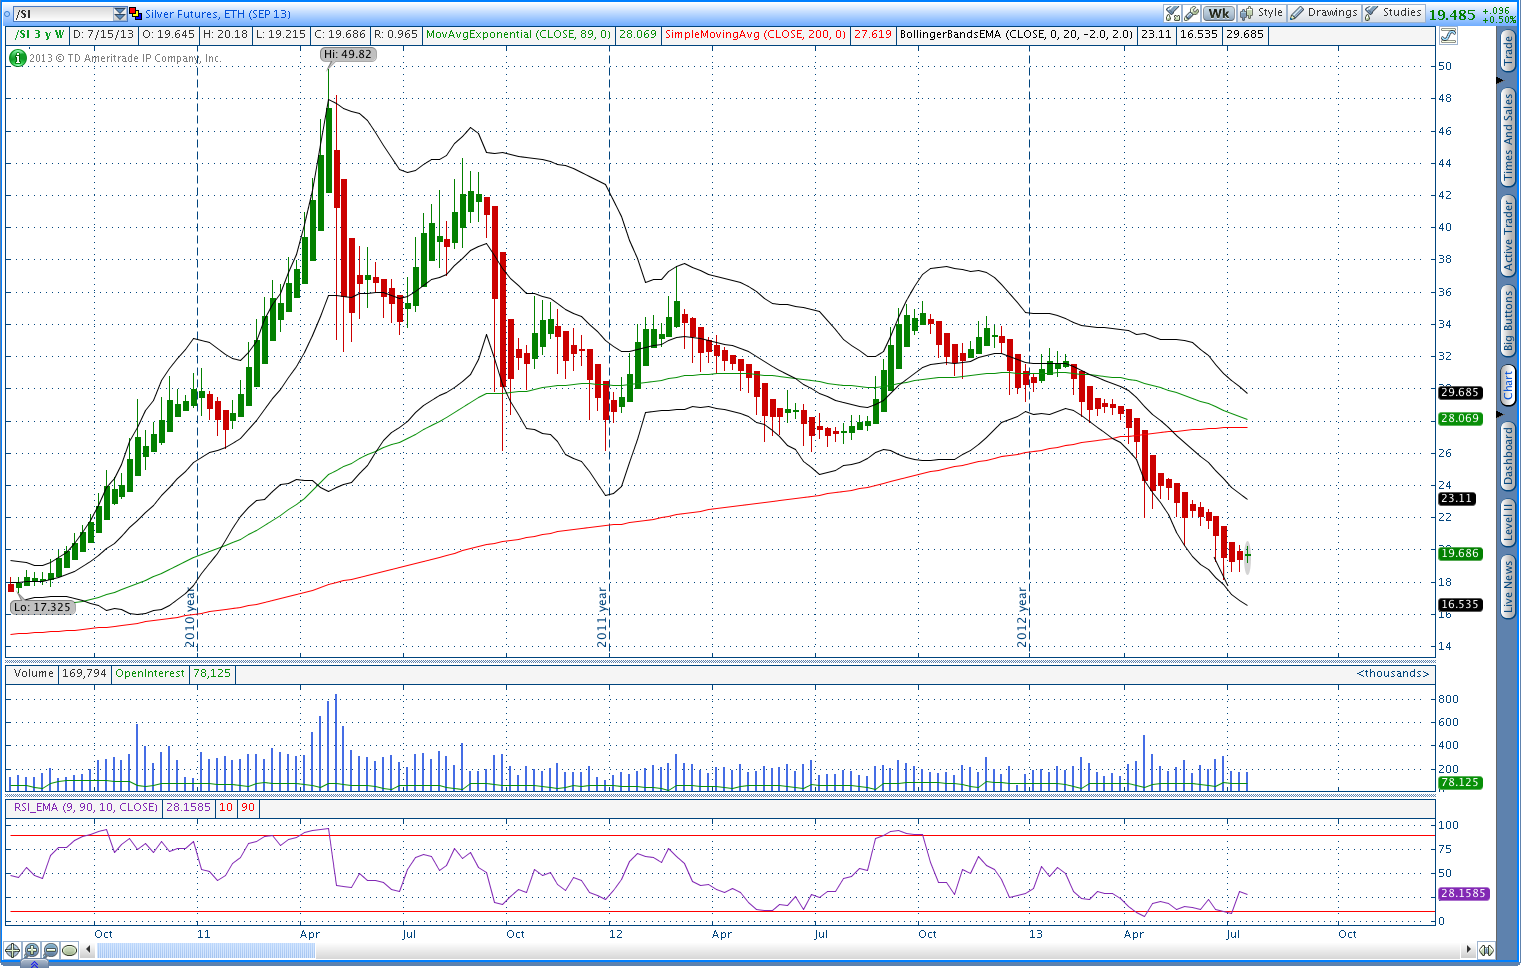
When we look at the yearly charts on a weekly time frame, it looks like we are finally showing confirmation that silver on a weekly time frame is forming a bottom. I have highlighted the doji on the Heikin Ashi chart above. This green candle shows indecision in price action with a slightly bullish bias. If my analysis is correct, even if we were to make a brief new low for this month the trend is slowly turning bullish. The price action over the next couple weeks will provide us the clues needed to confirm this analysis.

