Usually when the markets show hints of bubbling or topping action, the moves are parabolic and the angles we see on charts are very steep. While we clearly saw that in crude oil last year, I don’t see that pattern yet in gold. I think gold, crude oil and the S&P are looking bullish right now from a technical perspective. Bulls may require a bit more patience in natural gas, but coffee could be a good sleeper market for speculators. Let’s take a look at what the charts show. Keep in mind that this is my snapshot view of what I see on the charts at a specific point in time. My analysis is dynamic and my opinions can quickly change as conditions change.
Crude Oil
The chart for crude oil is looking bullish, in my opinion, when looking at basic trendlines. I will first draw a trendline going back from the December 1998 low and connect it with the November 2001 low. We can see that the market held that trendline during the 2009 correction. This is a positive sloping chart. We did see a parabolic move and a lot of buying interest in July 2008, when crude oil peaked above $147 a barrel. While the market corrected sharply from there, the positive slope on the weekly trendline tells me crude oil is still in a long-term uptrend. I would recommend buying breaks in this market.
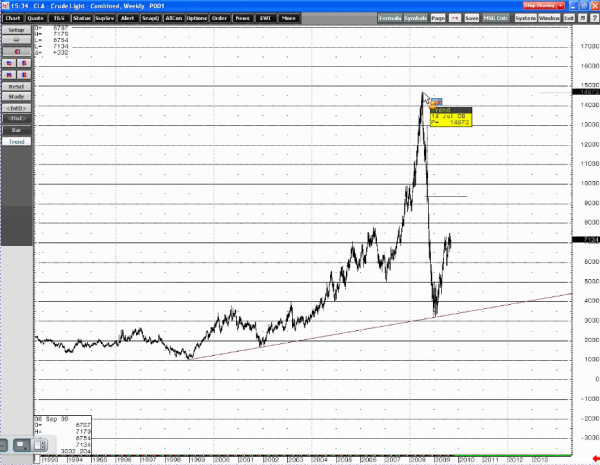
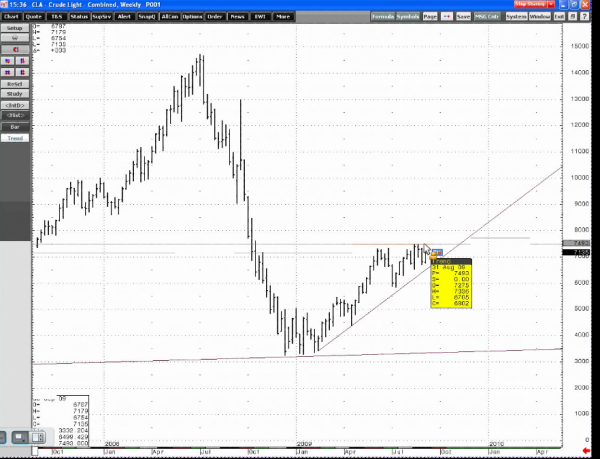
We can also draw a trendline from February 17, 2009, low to the low on April 20, and see that the market hasn’t violated that trendline either. To me that means this market will go higher, although it might see a trading range of $70 – $75 for a while before making a sharper move up.
Fundamentals look long-term supportive and should back the bulls. OPEC is expected to keep its output quotas unchanged, and the global economy should start to improve in the coming year. China is likely to increase consumption as well.
I see the next major resistance for October NYMEX crude oil futures at $75, just under last week’s high. I think a close above $75 would likely bring a test of $77, near the October 6, 2008 low. I would get bearish crude oil if I saw a close under $58. If the market took that level out, I could see a series of lower lows coming, or a possible new downtrend.
So for longer-term traders, $58 is critical support, and key resistance is at $75. Shorter-term traders looking to buy should set stops near $67. I think it’s only a matter of a year or two before we see $150 crude oil.
Natural Gas
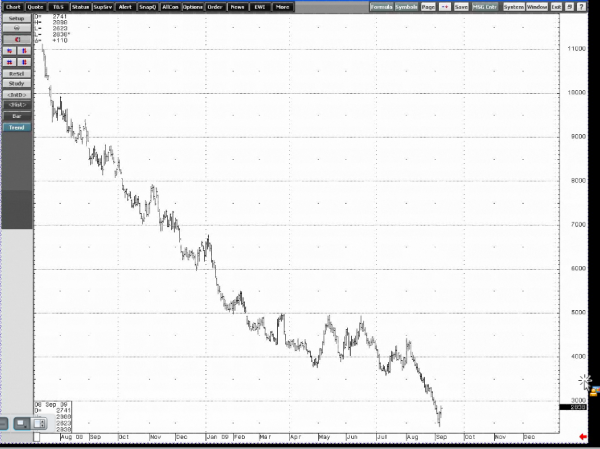
This market has left many people trying to pick a bottom frustrated, including myself. It’s been a great market to short over the past year and a half, but we could be seeing a great opportunity for the buyers coming up. Right now, the value of the E-mini natural gas futures contract is around $6,000 – $7,000, so you aren’t taking a big risk in buying and holding a contract as a long-term investment. There will always be some sort of demand for natural gas; it won’t go to zero. But even it is does, $6,000 – $7,000 would be the most you could lose on a contract.
Producers have a lot of excess natural gas right now in storage. The question is: what are we going to do with all this natural gas? Natural gas is a clean-burning energy source, and much of it is domestically produced. I’m surprised our leaders haven’t pushed for greater use of natural gas in our economy. It would be fairly easy to convert trucks to run off natural gas. That initiative is beyond the scope of this webinar, but I do see a tremendous opportunity in this market.
Long-dated natural gas futures contracts are pricing in a future increase in demand and decrease in supplies. The October contract is trading near $2.83 per million British thermal units, and January is trading near $4.92. You could consider buying the January contract with a stop under $4.67, the low on September 4. I think this market has a shot at $6 over the next three-six months. If that September 4 low is taken out, I’d get out of the long position and perhaps try to re-enter at a better price.
Gold
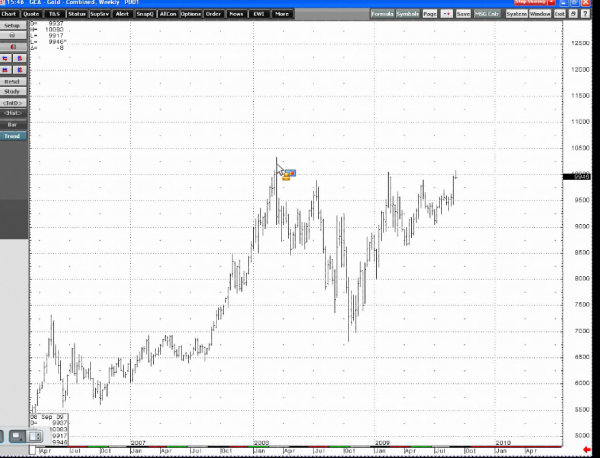
Back in 1997, gold was trading at about $300 an ounce, and you can see how this market has been rallying since. The long-term trend is no doubt up. The weekly chart looks very explosive to me. I can see a possible cup-and-handle pattern in the weekly chart, and I think it’s only a matter of time before gold takes out the March high of $1,033 an ounce. I think it’s coming soon.
Usually, when a market’s trend starts to show signs of exhaustion, we see a parabolic top. You are looking for a rejection of an extended up-period. You can see that in the crude oil chart I showed in my prior example from the 2008 peak. You can also see that in a current chart of sugar. However, I don’t see that in gold. I see a coiling pattern. Taking the recent high near $1,035 and subtracting the low at $681, I am looking at a possible projection of about $300 higher. That puts $1,300, $1,400, and even $1,500, as reasonable targets for gold in a continuation of its bullish cycle in the next two-three years.
What would get me negative? If the government starts to balance the budget and we have surpluses, or if the Federal Reserve stops buying Treasuries or starts aggressively raising rates to fight inflation. As you can see, it would take a big fundamentally change for me to change my opinion about gold’s trend.
S&P 500
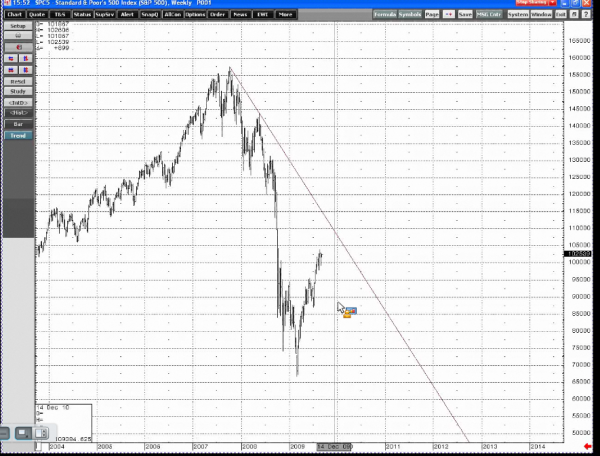
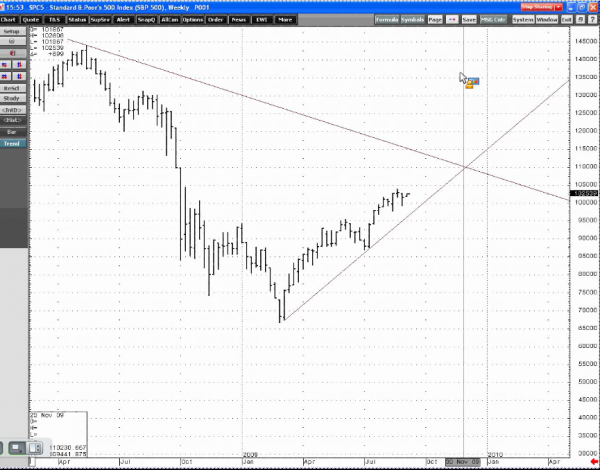
Nearly all investors have some exposure to the stock market, and are wondering whether the worst is over. Let’s look at the cash S&P index for a broad perspective. Connecting the highs from October 2007, we can see this market hasn’t taken out the downtrend line. I think by year-end, 1081 looks like a reasonable target. I would like to se a close above 1100 to confirm that the recent downtrend is over. Longer-term, I’m not sure if the stock market is out of the woods, but it is in an intermediate-term uptrend. The S&P futures have been making higher highs and higher lows since the bottom in March, which is a positive sign. I see the end of November is sort of a period of reckoning. We should know the next big trend by then.
Coffee
I would like to mention one more market that is sort of a sleeper for potential speculators. I like coffee’s prospects. Open interest is at a 3 ½- year low right now, and going back to 2001, the charts show the market is still in an uptrend. There is low participation in this market right now, and a small bullish catalyst could provide a springboard to $1.50 – $1.60 per pound.
Please feel free to call me with any questions you have about the markets, and to develop an appropriate trading strategy based on your unique goals and risk-tolerance.
Blake Robben is a Senior Market Strategist with Lind Plus, Lind-Waldock’s broker-assisted division. He can be reached at 800-266-0551 or via email at brobben@lind-waldock.com.
You can hear market commentary from Lind-Waldock market strategists through our weekly Lind Plus Markets on the Move webinars . These interactive, live webinars are free to attend. To sign up, visit https://www.lind-waldock.com/events/calendar.shtml . Lind-Waldock also offers other educational resources to help your learn more about futures trading, including free simulated trading. Visit www.lind-waldock.com.
Past performance is not necessarily indicative of future trading results. Trading advice is based on information taken from trade and statistical services and other sources which Lind-Waldock believes are reliable. We do not guarantee that such information is accurate or complete and it should not be relied upon as such. Trading advice reflects our good faith judgment at a specific time and is subject to change without notice. There is no guarantee that the advice we give will result in profitable trades. All trading decisions will be made by the account holder.
Futures trading involves substantial risk of loss and is not suitable for all investors. © 2009 MF Global Ltd. All Rights Reserved. Futures Brokers, Commodity Brokers and Online Futures Trading. 141 West Jackson Boulevard, Suite 1400-A, Chicago, IL 60604.


