

The futures market summary
WHITEHALL INVESTMENT MANAGEMENT FUTURES MARKET SUMMARY 01/14/10
SUMMARY OF UPCOMING DATA 01/15/10
8:30 AM US CONSUMER PRICE INDEX (0.1%, EX # 0.1%)
8:30 AM EMPIRE STATE MFG SURVEY (13.0)
9:15 AM US INDUSTRIAL PRODUCTION
(0.6%), CAP UTIL (71.9%)
9:55 AM US CONSUMER SENTIMENT (74.0)
DATA RESULTS 01/14/10
US RETAIL SALES (-0.3%/0.4%, EX AUTOS -0.2%0.2%)
US JOBLESS CLAIMS (444K/437 K)
US BUSINESS INVENTORIES (0.4%/0.2%)
EIA INVENTORY (NAT GAS, -266 BCF)
US 30 YEAR AUCTION ($13B- BID TO COVER 2.68. YIELD AWARDED 4.64)
US DEBT REVIEW AND OUTLOOK
The US Treasury complex gained within a favorable “Buy American” environment on Thursday. Bond prices were supported a number of data releases combined with the underlying sense of uncertainty plaguing the markets. US retail sales posted a surprising dip into negative territory, while US weekly jobless claims came in 7000 above expectations. In addition, comments from NY Federal Reserve President William Dudley suggested that the near zero short term interest rates could very well remain low for at least six months and possibly for as long as two years. Lower interest rates and a tame inflation outlook contribute to ideal environment for fixed income, particularly lower yielding government debt.
These elements may have contributed to the strong reception of the final Treasury auction of the week. $13 billion of US 30 years came to auction with a bid to cover (ratio of bids received to bids accepted) of 2.68. The accepted yield for the auction was 4.64%, compared to analysts forecast of 4.68%. Yield and price trade in an inverse relationship. This was the highest bid to cover for US 30 year securities since September of 2009. In a similar fashion to Wednesday’s US 10 year auction; direct bidder participation was above average. The current price stability in the US dollar offered additional support to the fixed income environment.
All of today’s positive factors for Treasuries should not lull traders into complacency. It is still the early part of earnings season and the degree of uncertainty in the markets, particularly in this time of the year when a certain percentage of traders embrace volatility as the year offers enough time to build a track record. (Many traders, while trying for a strong start, realize that gains or losses for the year are made within a few months-not over an even progression throughout the year.. While uncertainty often supports government fixed income, developments such as Intel’s surprisingly strong earnings results may contribute to growing volatility in both debt and equity futures markets. In short, there may likely be continuing full basis point swings-particularly in the longer end of the yield curve- going into the early part of February.
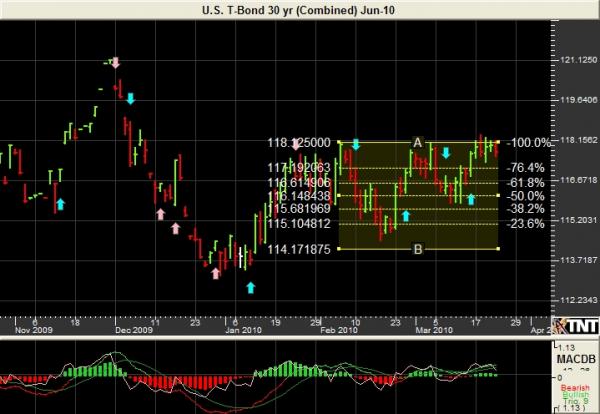
Technically, US 30 year futures continue within its pattern of testing a higher range level after failing to significantly pierce the 115-00 level. The market looks to be continuing to continue with an upward bias for the near term. Significant resistance should be met at 117-30, which represents a key Fibonacci level when measured from the range of December 3rd 2009. If this level fails to hold, the contract may attempt a run back to the 118-22 level. Downward pressure from significant levels of resistance, supply concerns, and a market correcting interest rate environment should pressure the market back toward a downside target of 113-23 by April.
US EQUITY REVIEW AND OUTLOOK
US Equities managed again to smile in the face of adversity, with the NASDAQ posting the best performance of the major equity indices. Technologies led the markets higher as the sector placed today’s hopes on the aftermarket earnings release of bellwether Intel. Optimism regarding the overall earnings outlook allowed the market to hold in positive territory for most of the US trading session, in spite of the disappointing US retail sales and new jobless claims figures. A better than expected reading on business inventories helped to counter balance the seemingly negative economic numbers. (Just goes to show that the markets need not always be fickle when they seemingly have a goal in mind.). If and when those goals are not met, the markets will begin to tell participants through actions such as market corrections and increased market volatility.
On the surface, the Intel numbers were better than expected. The company posted a 4th quarter profit of $2.3 billion or 40 cents per share, as compared to profit of $234 million or 4 cents per share the year before. Earnings had been expected at 30 cents per share.
Market activity after the release of the numbers was subdued. This is not surprising when one considers the early stage of the earnings cycle, as well as the degree of uncertainty in the global economic environment right now. As gains in the marketplace have been fueled by early elements of the recovery phase (stocks tend to rebound first), record stimulus, and the notion that most of the “shoes” have dropped; the next wave of uncertainty, equities greatest enemy, appears to gathering in the wings. This uncertainty, coupled with a likely need for the market to address its overbought condition, is the catalyst for the market correction that many analysts are calling for. The fact that so many are calling for or expecting this correction though contributes to the contrarian theory that the masses are almost always wrong when it comes to timing market moves. I suppose the most positive aspect of this growing uncertainty is that for traders-particularly futures traders- uncertainty leads to volatility-volatility leads to trading-trading leads to opportunity (sorry for the Yoda references). In these periods, traders should be particularly focused on refining their risk parameter and allocation strategies. This will offer additional support to ride out and take advantage of volatility and opportunities.
I believe the equity markets are due for an increase in volatility if for no other reason than that so many of the media outlets are pointing out that volatility has fallen to the lowest levels in recent memory. That’s a kiss of death if there ever was one.
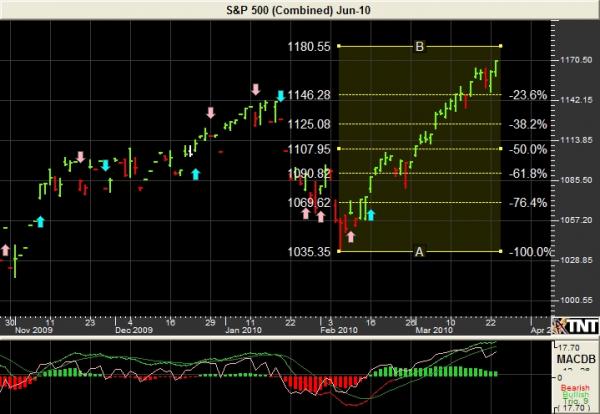
Looking at the S&P futures technically, expecting the market find a key level of resistance at 1152.00. This level should align with a daily RSI reading of 70, which is a traditional indication of an overbought market. A break through this level should lead to a step up to test 1158.00. Support for the March contract sets up at 1139.40. A break of this level should lead back to a retest of 1132.00, with 1126.00 as our downside target and a key support level.
COMMODITY REVIEW AND OUTLOOK
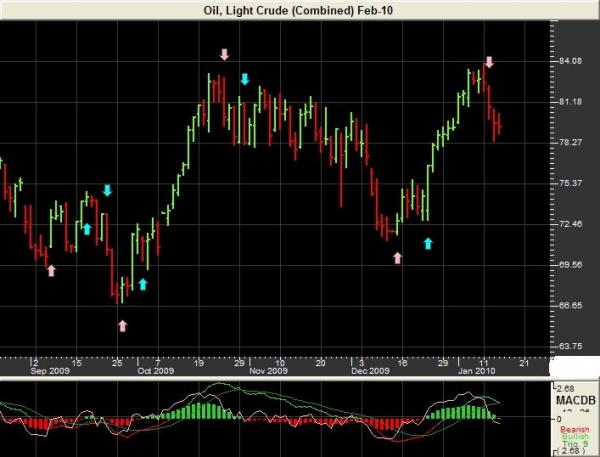
CRUDE OIL continue to shake off the recent “frost premium” as well as cope with the outlook of a world, at least for the time being, without China being the buyer of first and last resort when it comes to commodities. The question of whether traders will see $70.00 or $90.00 oil first is one best left for options players in my opinion.
The market does not appear to be finished testing the downside of its range. The $78.00 level appears to be a likely target for the February contract before it expires. $78.17 sets up as a strong resistance point for February and should hold initially. A rebound back to $78.60 should offer a potential day trading opportunity. These levels are based off a ratio where a move in either direction in the crude market of $1.40 to $1.70 often results in a retracement of that move back to 90 cents. It appears particularly relevant when the market is trending down.
SUGAR looks as if its upside move may be peaking out. While the potential for the market to trade to the $31.50 does exist, it looks as if the market may be settling into a range for the near term. The March contract should find significant resistance at the 29.20 level, while 27.08 sets up as an initial level of support. Look for 26.42 as a possible downside breakout level which could result in a longer term move back to 24.60.
|
US DEBT FUTURES |
OPEN |
HIGH |
LOW |
CLOSE |
CHANGE |
|
US H0 (US 30 YRS) |
115-27 |
117-03 |
115-24 |
116-25 |
+27/32nds |
|
SP H0 (S&P 500) |
1135.00 |
1145.00 |
1129.30 |
1141.60 |
+7.70 |
|
|
|
|
|
|
|
Prepared by Rich Roscelli & Paul Brittain.
PLEASE VOICE YOUR MARKET OPINIONS, THOUGHTS, AND QUESTIONS. EMAIL TO RICH@BINVSTGRP.COM
Additional Information can be found at WWW.WHITEHALLVEGAS.COM
Please accept our invitation to attend Commodity Trading School. The site offers FREE online classes from a variety of experienced trading professionals. There is no obligation. In addition to the classes, those who sign up for the school will receive a trial subscription to our trading newsletters THE BEAST and the BIG MACDADDY.
To sign up, please visit www.commoditytradingschool.com
Past performance is not indicative of future results. The information and data in this report were obtained from sources considered reliable. Their accuracy or completeness is not guaranteed and the giving of the same is not to be deemed as an offer or solicitation on our part with respect to the sale or purchase of any securities or commodities. Whitehall Investment Management, its officers and directors may in the normal course of business have positions, which may or may not agree with the opinions expressed in this report. Any decision to purchase or sell as a result of the opinions expressed in this report will be the full responsibility of the person authorizing such transaction.

