
OPTION TRADE OF THE DAY!
5-15
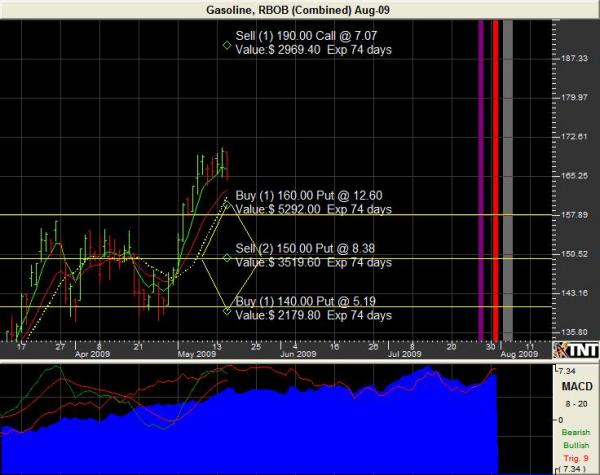
Gasoline Put Spread- RBOB, as it’s now known, seasonally peaks out as we enter into the driving season, this is because the gasoline distributors order their inventory BEFORE driving season, not after it begins. So the seasonal tendency to the upside starts in February and pretty much ends now. There are several ways to take advantage of the expected drop with various degrees of risk. You could do a Bear Put Spread with a Naked Leg which is the more aggressive approach; buy the August 160/150 Bear Put Spread and sell the August 190 Call as your naked leg, this trade would be a credit spread with no risk under 190, however above 190 you would have unlimited risk. This trade has three commissions so you have to deduct the costs from the premium you’d collect which should be around $600. A less aggressive method would be a Butterfly Put Spread buy one August 160 put; sell two 150 puts and buy the 140 put, this trade would have limited risk without a margin requirement. The cost is about $450 PLUS FOUR commissions, which is your risk, the profit potential is limited to $4,200 minis these costs with the market at 150 on expiration. Above 160 or below 140 the trade would be a loser.
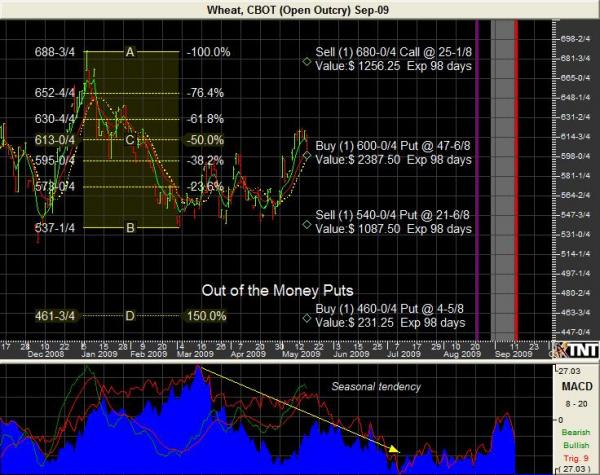
Wheat seasonally peaks out here as well, we like the September 600/540 Bear put spread with a Naked Call at 680. This should be filled at a small credit (minus 3 transaction costs) so the risk would be over the 680 level, where you are synthetically short the market. The profit potential is limited to 60 cents or $3,000 before cost considerations. We also like deep out of the money puts.
* There is a substantial risk of loss in trading futures and options.
PLACING CONTINGENT ORDERS SUCH AS “STOP LOSS” OR “STOP LIMIT” ORDERS WILL NOT NECESSARILY LIMIT YOUR LOSSES TO THE INTENDED AMOUNTS. SINCE MARKET CONDITIONS MAY MAKE IT IMPOSSIBLE TO EXECUTE SUCH ORDERS.
Past performance is not indicative of future results.
The information and data in this report were obtained from sources considered reliable. Their accuracy or completeness is not guaranteed and the giving of the same is not to be deemed as an offer or solicitation on our part with respect to the sale or purchase of any securities or commodities. Alaron Trading Corp. its officers and directors may in the normal course of business have positions, which may or may not agree with the opinions expressed in this report. Any decision to purchase or sell as a result of the opinions expressed in this report will be the full responsibility of the person authorizing such transaction.
FOR CUSTOMERS TRADING OPTIONS, THESE FUTURES CHARTS ARE
PRESENTED FOR INFORMATIONAL PURPOSES ONLY. THEY ARE
INTENDED TO SHOW HOW INVESTING IN OPTIONS CAN DEPEND ON
THE UNDERLYING FUTURES PRICES; SPECIFICALLY, WHETHER OR NOT
AN OPTION PURCHASER IS BUYING AN IN-THE-MONEY, AT-THE-MONEY,
OR OUT-OF-THE-MONEY OPTION. FURTHERMORE, THE PURCHASER
WILL BE ABLE TO DETERMINE WHETHER OR NOT TO EXERCISE HIS
RIGHT ON AN OPTION DEPENDING ON HOW THE OPTION’S STRIKE
PRICE COMPARES TO THE UNDERLYING FUTURE’S PRICE. THE FUTURES CHARTS ARE NOT INTENDED TO IMPLY THAT OPTION PRICES
MOVE IN TANDEM WITH FUTURES PRICES. IN FACT, OPTION PRICES MAY ONLY MOVE A FRACTION OF THE PRICE MOVE IN THE UNDERLYING
FUTURES. IN SOME CASES, THE OPTION MAY NOT MOVE AT ALL OR
EVEN MOVE IN THE OPPOSITE DIRECTION OF THE UNDERLYING FUTURES CONTRACT.
Paul Brittain
Alaron Trading
800-935-6492
702-255-4107
702-256-0186 fax

