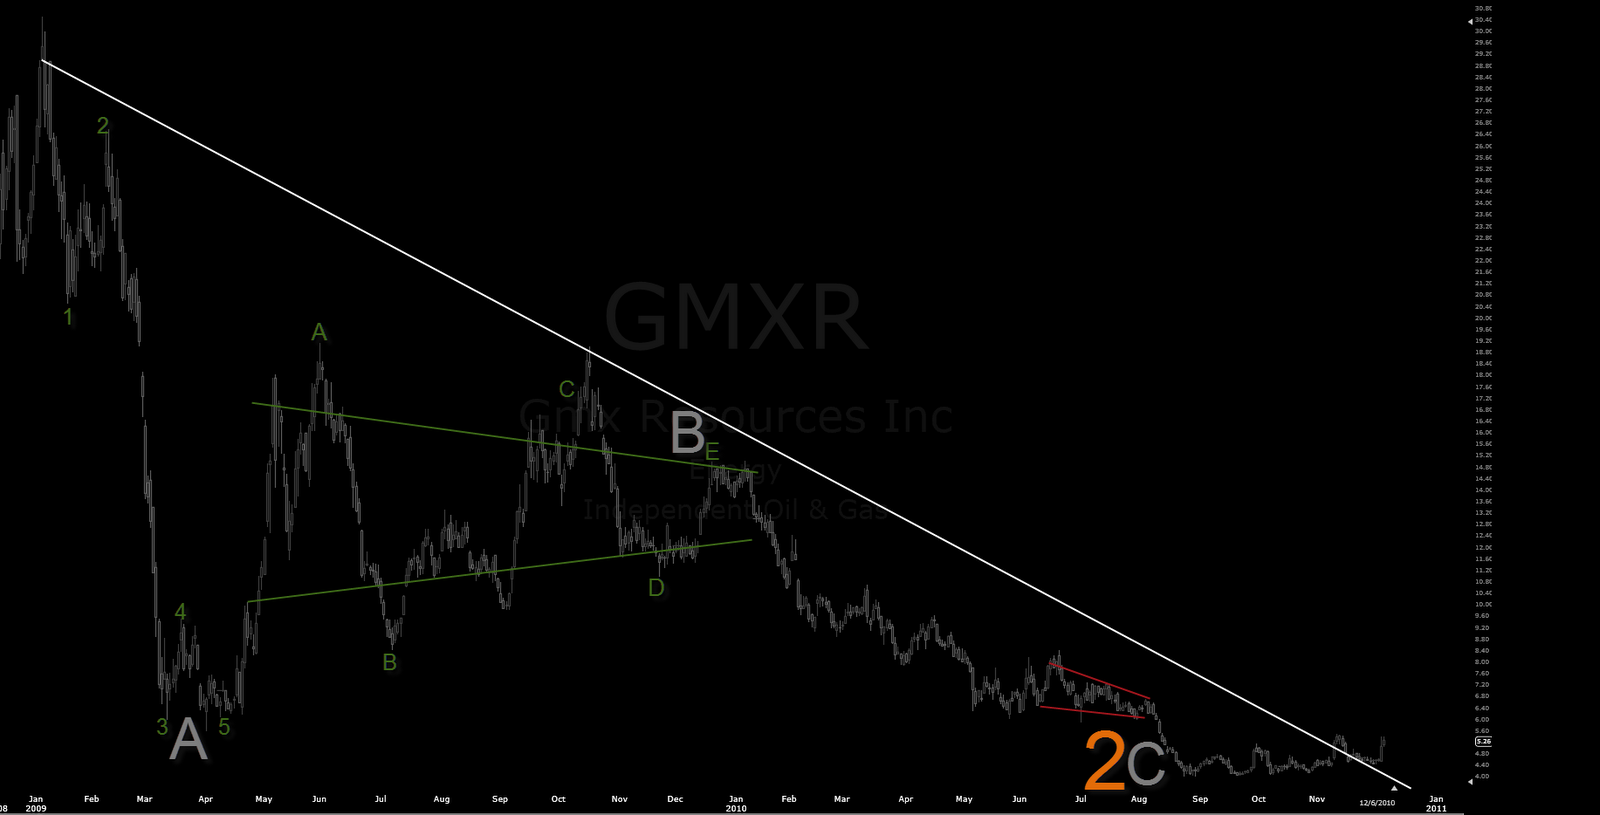
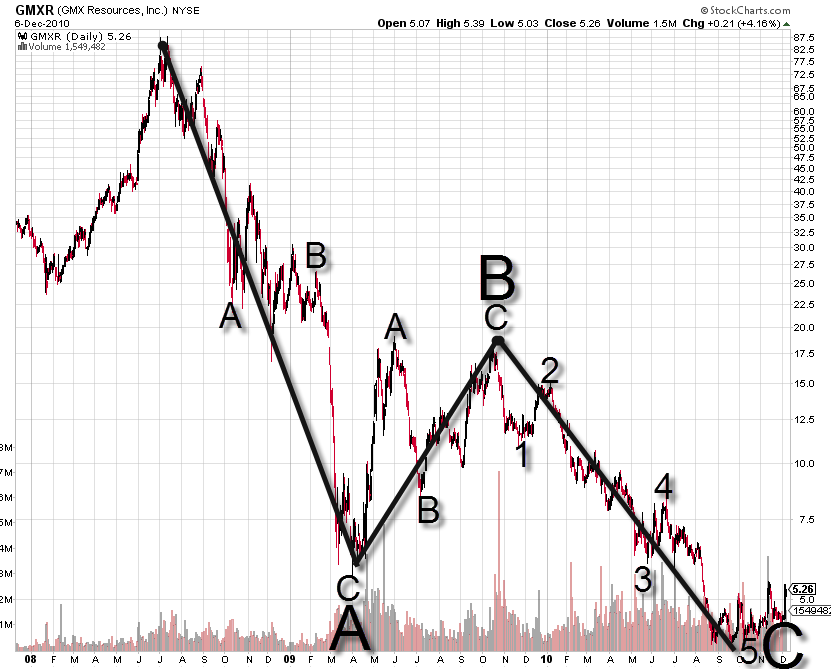
GMXR Resourches, GMXR + Pyramid Oil, PDO, Mexico Energy, MXC
I sold my FTK diagonal today. It has run now for my christmas target and I did scare of a bit what technicals did for it, but I have to confess technicals looks a bit wild all over and can do weird things. Dumped also my CMM also because it looks for me this is somehow related very much for oil and energy related indursty, so I assume I am bullish with oil and energy. It was fully buying action I did today. Added also my MEG, LF, PKD, MTW, ORD, ORN, DAC, CV.
There is some charts on there I do not like that all, some looks scary for me. TRGL, WNR for instance but they can be also related for some on-going leading diagonal. It was just quicktechnical peak for them I checked.
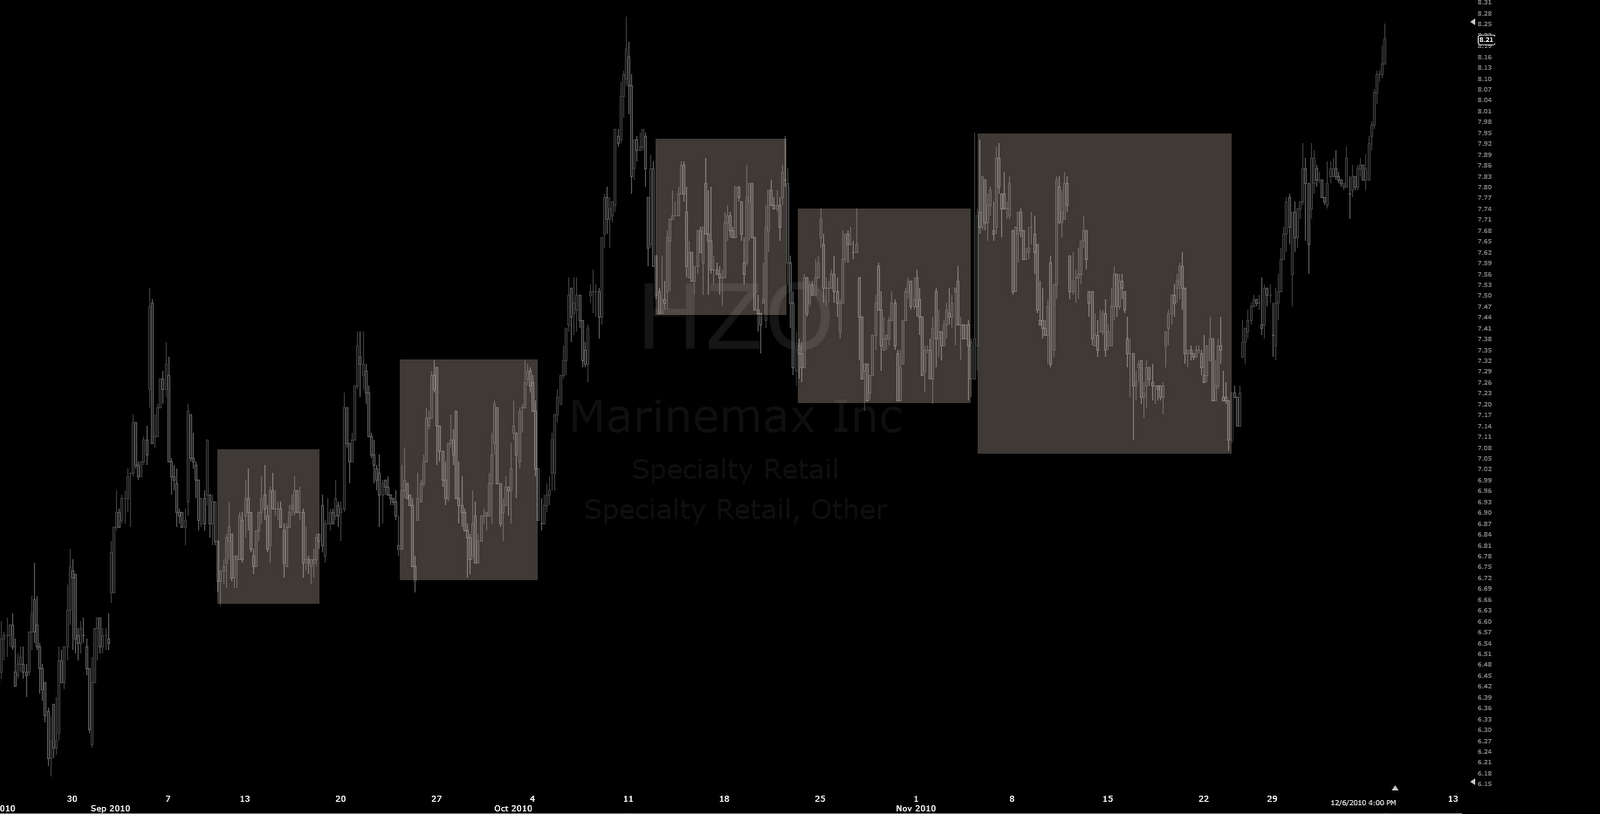
I also bought back my MarineMax Chart (HZO) and Neutral Tandem (TNDM), my original EW count for both of them a few months ago was correct but I did leave them too early. It was also first time in my life I did behave with on-going impulse to do anything as entry but contracting pattern was just leaving it, not ideal E wave entry but just a few candles late (HZO).
For any financials I didn´t touch, something with many them warns me that something might be missing. Only exception is PACW where oscillators confirmed for it well enough.
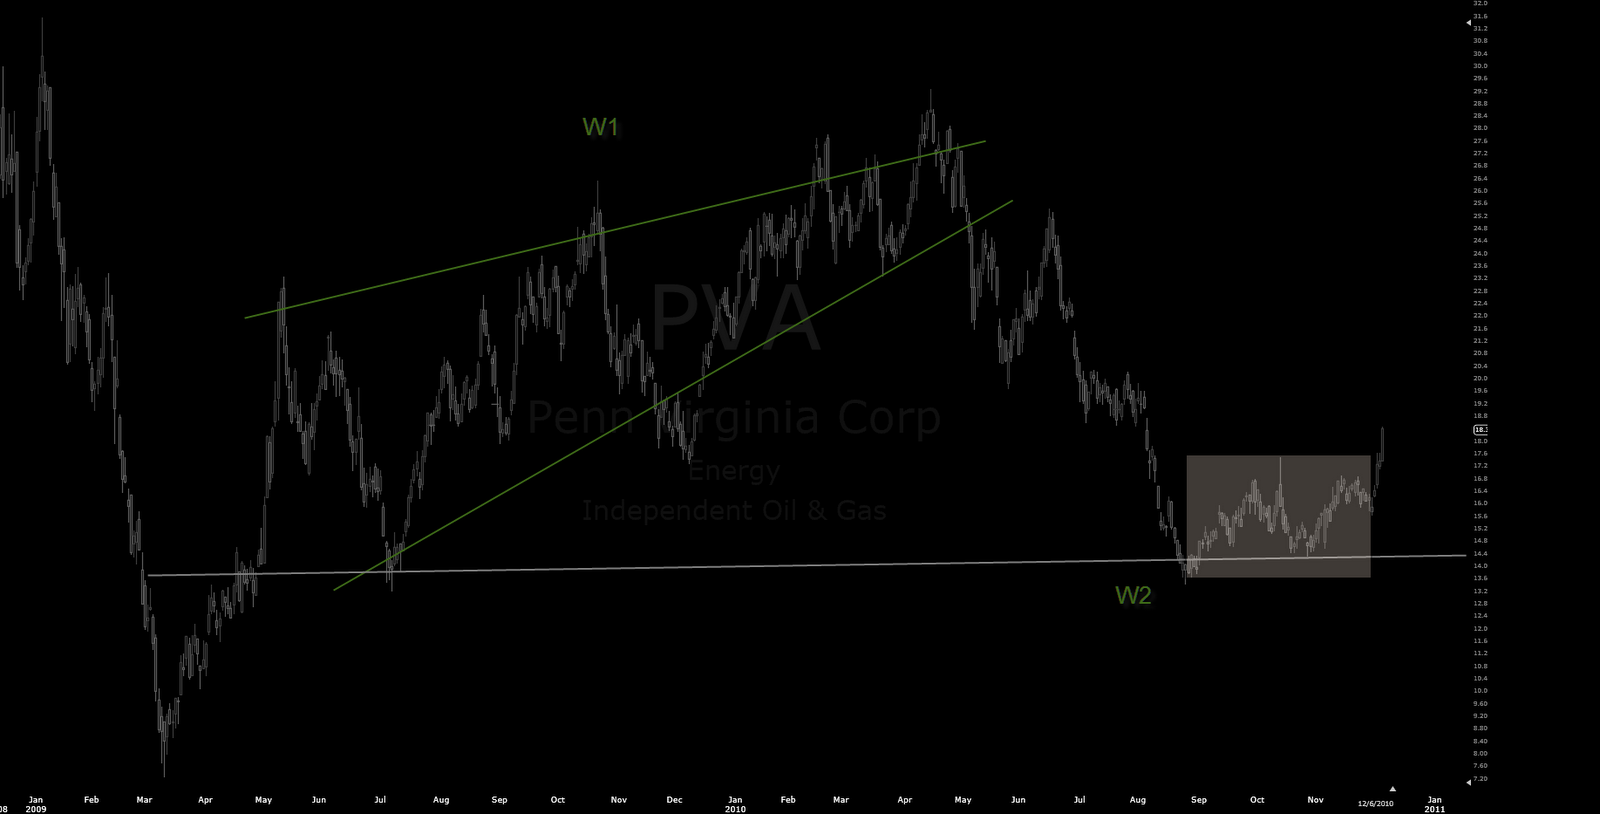
After charting with meta pretty much 24H for last 8 days and looking these all and over, some of them are very major W2 territory areas for reasonable large charts, basically behind of 3 years ie. behind of actual financial chrisis also, so it is likely reason why oscillators looks a bit wild with them.
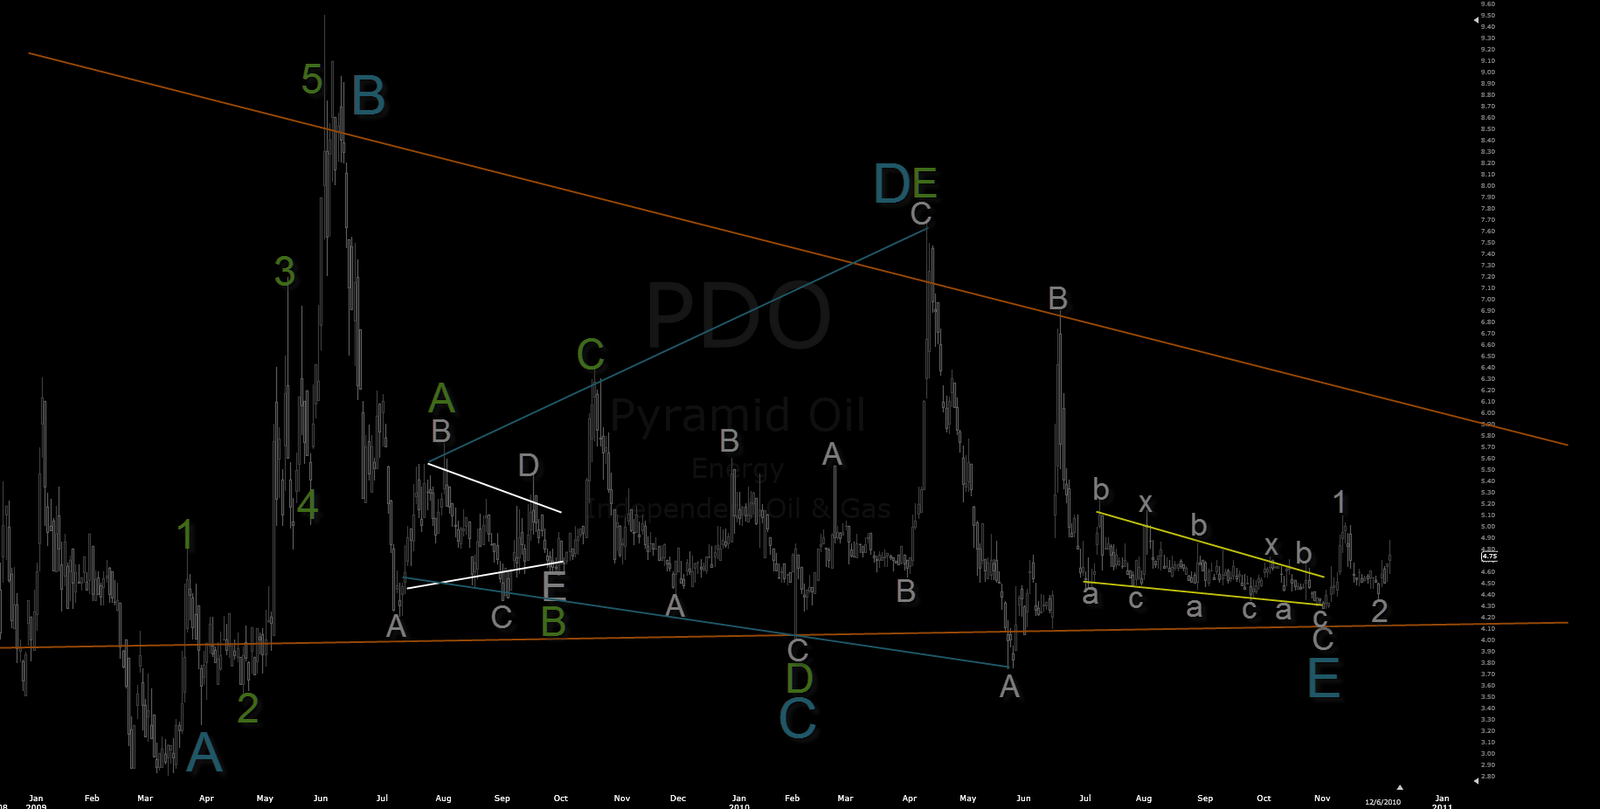
For instance MXC could be under very significant turn in here for long time to come. PDO have also ending diagonal on there, it can be ending something larger which is not in this chart. It didn´t come clear of me why it is there but they are stockcharts and it is my pattern. That D is way too agressive also to be contracting triangle D, but Neely triangle it is.
I am EW theorist, I do react for any potential W2, A or B bottom conditions but I cannot know for sure is it true, I just need to know where my stops are. Technicals can then confirm these things to indicate something could it be true at all or not what you are potentially looking. I do not touch for any potential running W3, at trading approach it is likely the best area to be. At investment point of view, it is too late for my taste.
For year 2010 it was most busy day I have had at so far. No trading today at all, was just buying.
I am looking long swing as timeframe target, not coming out for some time to become if this scenario works, not this year anymore.
That Suntec chart which took a bit wild start, the chart is suggesting it to be for very large scale as 12345-AB bottom ie. one impulse behind and AB conditions placed for it, potentially opening C up wave for 3 years chart. It is also harmony bullish bat with that AB condinitions ie. 86.2%, most typical size for B wave.
To “jump in” for something like that and you are just saying for the market you didn´t see it on time what it can be the chart have no matter what it would do. To jump in for it after reaction like that, “the risk phase-II” is allready set, it can also contract as next and alternate it and you bought the local peak of the day.
CPN I skipped, MEG I did accept. MEG is also exactly the same chart as SPX had on last week, it might come very fractaled chart at some stage if it is doing anything similiar as SPX did during the passed few weeks with those expanding triangles.
That Suncor I am also skipping for some time to become, it has done some of the most weird things for me over the passed months with that complex pattern and something is not well with technicals with it. There can be something on-going, longer running and ultra complex sideways zigzags with it, still.
Invested if not stops out.