Saturday 2 February 2013
The January monthly charts are now complete. Not sure that anything new can be
learned, but it is always worth looking, never presuming anything. Remember, the
point of reading developing market activity is to make factual observations of the
information that the market is generating.
The information takes the form of highs and lows for successive bars, over any/all
time frames, where price closed, [telling us who won the battle for that bar], along
with volume, the energy/effort of each bar. It reflects the bottom-line decision-making
of all participants, but our interest is learning what smart money, [those who control/
influence the market the most], is saying in their net decisions, for they always try to
mask their intent. Their “fingerprints” are all over the market, usually in the form of
high volume days, for it is not the public that generates high volume. We proceed:
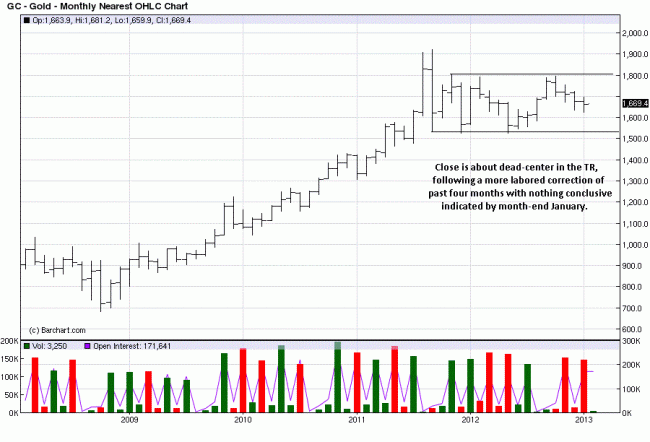
January was a smaller range bar with the close just above mid-range. The smaller
range, also being the 4th bar lower in a correction, tells us that sellers were unable to
extend the range lower. Therefore, buyers are influencing price direction when it moves
to these lower levels. That can change next week, next month, but it is what we know for
certain for right now, the present tense. The fact that price closed just above mid-range
the bar also tells us buying is not that strong, just as selling is not.
Putting this into context, price is in a protracted trading range, [TR], and the current price
is in the middle of that range, so we could be pushing on a string to formulate any decisive
conclusion. This, despite the strong forces/convictions of those on the long side, opposed
by central bankers/governments, ostensibly selling forces, or so they lead one to believe.
To read entire article and see all charts, click on http://bit.ly/WFC3wL and for any
questions/comments


