

Gold has been an interesting topic lately as it struggles to find its footing. While it’s been in a long-term uptrend for over fourteen years, we are approaching an important crossroad. The chart I want to take a look at today spans the entire advance from 1999. I don’t want to focus on any specific indicator or pattern, just one simple trend line.
When performing technical analysis some of the best views are the simplest.
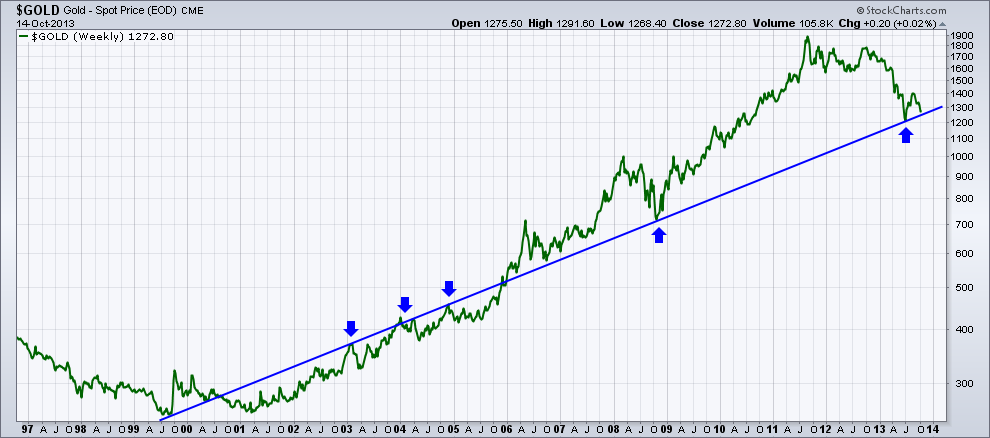
Off the 1999 low the blue trend line has played an important role for gold traders. It acted as resistance during short-term advances in 2003 and 2004 and then we saw gold prices break above in late 2005 which began the strong bull multi-year advance that took us into the financial crisis. During 2008 as investors attempted to sell everything they could get their hands on, gold fell nearly 30% before finding support at this trend line.
Since 2011 gold has been in a fairly steep down turn coming off its advance from the 2008 low. In July of this year we saw another touch of the trend line as gold prices attempted to stabilize. However, bulls of the shiny metal still haven’t been able to grow their membership and we are seeing prices continue to head lower. As we approach this critical trend line for the second time this year, we may see it break as traders set their targets on $1200, the previous 2013 low. Will we break? Or will we rocket higher $2000 an ounce? Your guess is as good as mine. In the mean time I’ll be watching this trend line as well as the previous low at $1200 to see if buyers are able to step in to defend their ground or if the selling pressure intensifies.
Disclaimer: The information contained in this article should not be construed as investment advice, research, or an offer to buy or sell securities. Everything written here is meant for educational and entertainment purposes only. I or my affiliates may hold positions in securities mentioned.

