

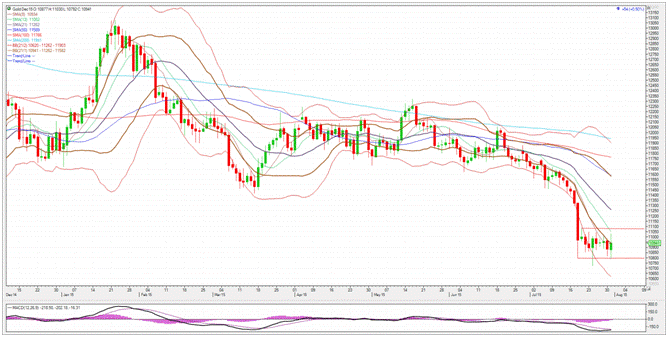
There is consolidation going on in Gold. Since making a low on July 20th at 1080.00, Gold has traded between 1079.20 and 1108.80 with a smack down to 1072.30 on July 24th. A ledge has formed and it has formed an outside day candle today and an inside candle for the week. This could potentially set up a break out for Gold. A move below this week’s low of 1079.20 could set Gold on a course to the Feb 2010 low at 1044.50. Closing above the 13 day moving average (1105.20) could lead to a test of the 21 day moving average up at 1126.20. I look to be short on a breakdown of the lows for a push to 1044.50 and long if Gold closes above the 13 Day moving average. The Candle setups on the daily and weekly charts could lead to a breakout in either direction. Look to go with the breakout. Place stops in accordance to your risk tolerance.
One option trade to look at calls for buying a Gold option strangle which calls for buying a put and call at the same time. I therefore propose looking at buying the September Gold 1130 put and buying the September Gold 1125 call for a purchase price of five points or in cash value $500.00. The risk on the trade is the price paid for options plus all commissions and fees. Keep in mind September option expiration is August 26th.
For more information, go to Walsh Trading www.walshtrading.com
RISK DISCLOSURE: THERE IS A SUBSTANTIAL RISK OF LOSS IN FUTURES AND OPTIONS TRADING. THIS REPORT IS A SOLICITATION FOR ENTERING A DERIVATIVES TRANSACTION AND ALL TRANSACTIONS INCLUDE A SUBSTANTIAL RISK OF LOSS. THE USE OF A STOP-LOSS ORDER MAY NOT NECESSARILY LIMIT YOUR LOSS TO THE INTENDED AMOUNT. WHILE CURRENT EVENTS, MARKET ANNOUNCEMENTS AND SEASONAL FACTORS ARE TYPICALLY BUILT INTO FUTURES PRICES, A MOVEMENT IN THE CASH MARKET WOULD NOT NECESSARILY MOVE IN TANDEM WITH THE RELATED FUTURES AND OPTIONS CONTRACTS.

