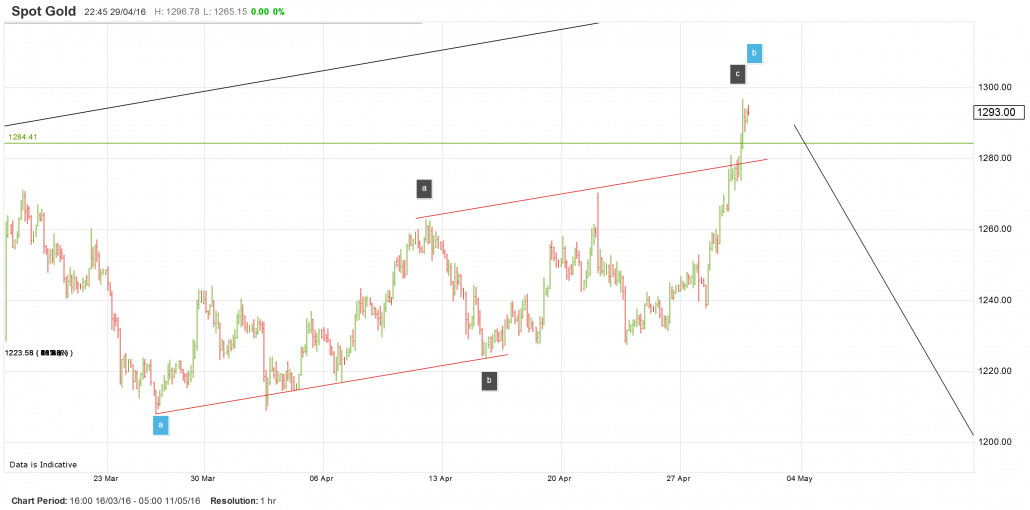
Gold pushed a lot higher than I had expected it to this week, breaching the price at the top of wave ‘a’ up in green. I am still an unbeliever in this rally. and I have labelled the medium term count to reflect that.
This week’s action is being viewed as an expanded flat correction in wave B green. The price action over the last few weeks is utterly corrective in nature and seems unfinished.
The count needs a good sell off to complete the structure properly, and that is what I have been looking for of late.
Medium term chart:

The market needs to make a new low below the wave ‘a’ low in blue in order to call the correction complete. that is just what the wave count calls for.
You can see that all this sideways action has not even managed to bring the macd line substantially negative despite flirting with the zero line recently. See my guide to MACD to see what are expectation from this momentum indicator
I would prefer to see a dip below the 1200 handle to call this correction over and look higher in wave ‘C’

The short term count shows the ‘blow off’ nature of the rise this week. It is like everyone suddenly ‘believed’ in gold.
This sort of crowded trade does not usually turn out well for the participants as the crowd is almost never correct. I will be looking lower next week to see if the market will shake out those bulls and create a more sustainable low around 1200. If this happens, I am a buyer!


