With gold breaking out of its existing price range – a little earlier than anticipated, I thought it high time to tell you what makes gold prices move the way they do. Of course, many people have views, like “it’s a hedge against inflation”, “China is buying up all the gold to bolster its reserves”, “India, as the world’s jeweller, needs more of it, because of the high demand”, ” you can buy gold from vending machines in Dubai Airport”.
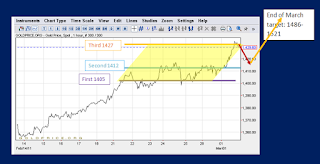 |
| Gold Prices in March- bullish momentum |
If you are satisfied with such airy-fairy stories, then don’t bother reading on!
I also said that for a while prices would stay in a range between US$ 1405 and 1450, – well realising that prices could go as far as 1460 as maximum, – but not really believing that we would hit this level just now!
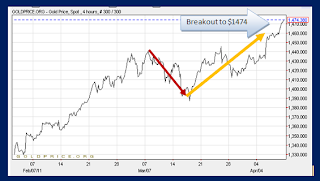 |
| Gold prices in April, – bullish reality comes into play |
As of last Friday, – and in consequence to the ECB raising interest rates for the EURO, gold recorded new highs of US1475 per oz.
Short-Term Gold Prices
There is little to suggest that this is a ‘real breakout’ from the technical analysis perspective. Which is why we need to look for other facts and indicators to seek clarification. The current move could still proof to be a ‘false breakout’. In that case a price correction should start right this week, and – we may see
prices tumble to the 1300s again within the space of 5-6 weeks.
And yet, potentially, the door is now ajar to head for the next significant $1,500 level.
Background Issues
Gold – as I so often say – has intrinsic value, to which other denominators adjust. If a denominator (=USD) shrinks then the gold price will have to rise.
Allow me to illustrate my point by introducing additional, undeniable perspective: Gold prices for investors outside the USD perimeter are not at all seeing the same picture. To enable a comparison, let’s start with what prices look like in USD –
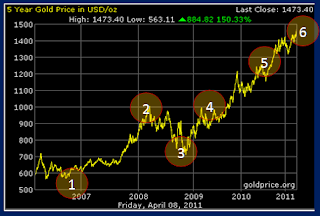 |
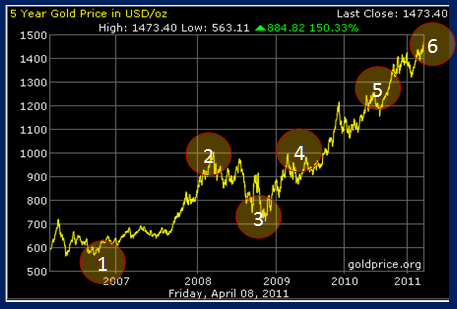
| Gold over 5 years in USD rises 130% approximately |
- first over 5 years, – and
- second the last 18 months
There are numbers, 1-6, on the chart:
1 refers to late 2006 and the lowest point for gold prices in recent times. It is also the starting point of the current rally.
2 refers to a first peak in February 2008, followed by …
3 the low in October 2008. This when the rally started in earnest.
4 refers to December 2009, another telling peak for gold prices.
5 refers to July 2010, after both gold prices and stocks had rallied from earlier in the year. The relevance of this point is more obvious after you see the USD chart (see below)
6, finally, refers to the here and now.
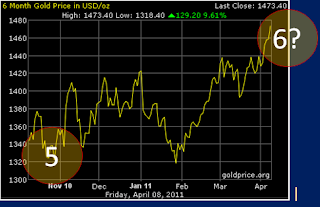 |
| 18-months view: Volatility in gold prices mirrors volatility in USD currency |
The chart over 18 months is of interest because it will help highlight the relationships between gold, the USD – and other currencies, namely the EURO, AUD and SGD.
The USD as its most frequent reference currency is shown in the next chart, and here, too, the same points in time are marked. You can observe that the price of gold is inversely correlated to the USD, – for most of the time.
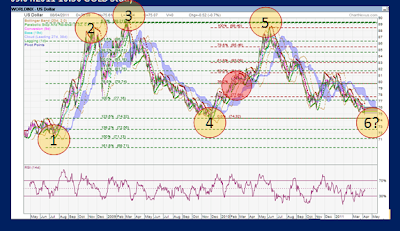 |
| USD trading ranges over 5 years. RED DOT points to stock market low in March 2009 |
The swings in the USD over the last 5 years were huge, but within a defined range: the top was around 89 and the bottom around 71, creating swings of almost 30% each way.
But of course, it was not just this inverse relationship between gold and the USD that shapes gold price charts, the stock markets, too, brought about some effects, – not too often, and not always totally ‘logical’, but there we are.
 |
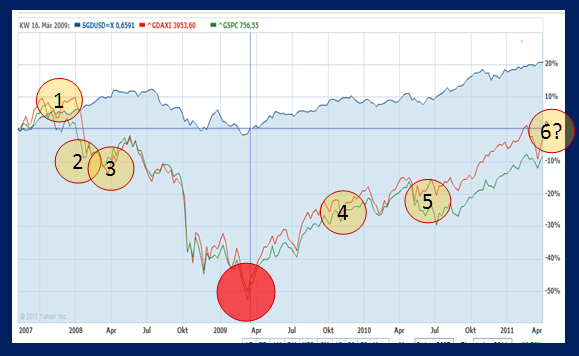
| The Singapore Dollar, and world stocks |
In the following chart, you can see the graph of the SGD vis-a-vis the USD, adding in the S&P 500 and the German DAX, i.e. stocks of major developed markets. The blue line above the blue space shows the SGD. Most of the time during the period, markets are ‘underwater’.
During the period of 1-3, (onset of the 2008 crash) we note that stocks fall sharply, – and the flight into the dollar causes the currency to soar, while gold prices give way.
From this point, 3, the USD plummets to a significant low in December 2008, see 4. However, thereafter it starts to recover rather promptly, as the stock markets take two more steps down into March 9, 2009 (RED DOT). By that time, gold ALSO recovered from its low in December to an April high in 2009! For a few short months, the traditionally inverse relationship had been negated.
A few technical analysts, including myself, dared to point out the bullish divergence that this setup promised for stocks and shares, when sentiments were at rock bottom.
As of April 2009, markets reacted buoyantly to the impact of QE1: As a direct result, Gold corrected, stocks selectively rallied. More poignantly, the USD also strengthened till the summer 2009, see 5, – but that was it! It has fallen ever since.
- Do I think that the USD can now fall further Well, the lowest point in the current range bound trading so far was 71, still about 12-15% below the current level.
- Would gold rise in tandem Probably, but it may not be quite so straightforward.
Other currencies are coming into play more and more. For instance, the so called resource currencies like the AUD and CND, which have a lot of gold to sell and are therefore positively correlated to the precious metal, while those with positive cash flow like China and India, buy their resources at their own terms. The USD has been largely sidelined in those deals.
Gold and the non-US Dollar Investor
To really get to grips with investing in gold profitably as Singapore dollar investors, have another look at how our currency fared in all this (chart above):
- over the same 5-year period, the SGD appreciated against the USD by 20%.
- the currency responds more likely to economic strength and growth, and not as a stop gap for security when all else fails.
- it really only got into some trouble ( a variance of about 10% against the USD) during the final months in 2008 and early 2009.
- thereafter the SGD rose in line with stock market fortunes, – or putting it more aptly – as the USD suffered the consequences of excess liquidity that was being pumped into the financial system.
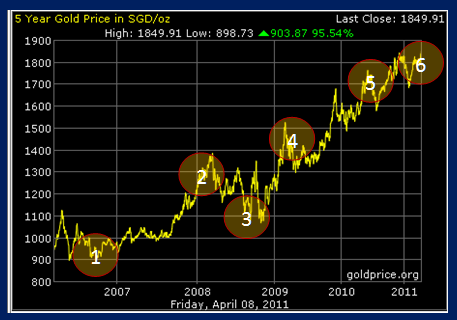
How did gold fare in SGD terms
Over the 5 year period, gold prices rose rather more steadily by comparison. Only the 2008 crash shows a notably correction of about 30%. As must be expected the total rise of the gold price in SGD terms rose less than in USD terms, 50% less to be exact.
Please take note, that a 20% rise in SGD versus the USD did not result in an equivalent 20% lower price in gold, but a much lower price.
Still as it is the high point gold in SGD terms was very recently, as is the case with the USD.
Let’s look are Euro Investors, who ‘by right’ should be more keen to buy gold now in light of their protracted credit problems:
- the rise looks rather more parabolic (i.e. increasing as the rally continues) over 5 years
- the correction during the stock market crash hardly creates a 10% loss.
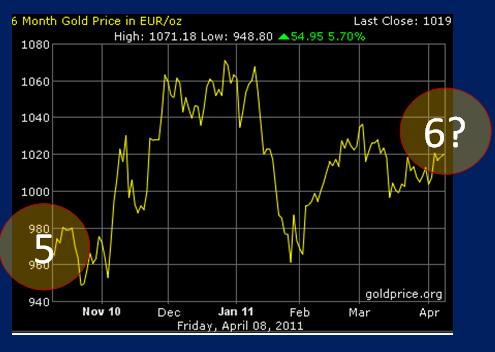
- The highest peak was recorded for early February 2011 ( – and has not been confirmed since (SEE 18-MONTHS GRAPH BELOW).
With the Euro now above USD 1.44, it is starting to become a nightmare for the financial architects who want to solve the Euro debt crisis on the one hand, – and the European export industry on the other.
Is it conceivable that the Euro will strengthen further Well, – yes, as it is really only strengthening markedly against the USD, and only marginally against Asian currencies for example. Nonetheless, a high Euro is going to cause problems sooner rather than later, as Europe as a whole are not producing the same economic fanfare as US, let alone the Asian economies do.
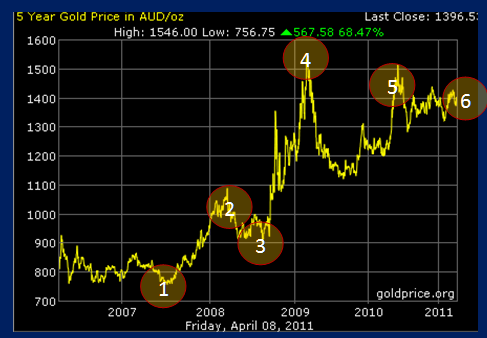
One last look at gold prices before it is time for a definitive statement on the subject, this time gold prices in AUD:
- The correction during the stock market crash is about 15-18%, …
- then a parabolic rise into April 2009, a peak that has yet to be surpassed!
- point 5 and 6 suggest at least a partial correction in precious metals from an Aussie dollar investor perspective.
- Connecting point 1, 3 and 6 however, indicates that the overall uptrend remains on track!
What’s the Message
- To buy gold with gusto, you have to have a currency that is particularly weak. The stronger the currency, the less actual gain can be made.
- The argument of buying against inflation… Go Google, – the last time I read about it, it appears that gold has yet to catch up with actual inflation since its heydays just after Mr Nixon removed the direct link between USD and gold. And of course, one ponders as to what inflation figures you want to trust…
- Gold does not beat stocks over a long term perspective. Again, I am not in the habit of reproducing what’s already published in the web, but equities show gains triple that of gold over a 25 ()- year period.
Are gold prices reaching bubble proportions
I think the argument is totally SILLY. If gold was able to generate wealth, hedge against inflation, and produce an investment return, may be this question would be of relevance. But as it is, – gold prices are a product of nominal currency interplay. Currencies are the ones that fluctuate, – NOT THE GOLD PRICE PER SE. If currencies were stable, gold would cost the same most of the time. If currencies were pegged to gold, we would see NO change gold prices, – and only very little inflation!
No matter which currency you wish to single out as an example, it does NOT fall into a bottomless pit so easily. Therefore, gold prices will not rise to gleefully publicised level of 5,000 or higher – just yet! Of course, this excludes the scenario of hyperinflation, when much greater potential mayhem looms.
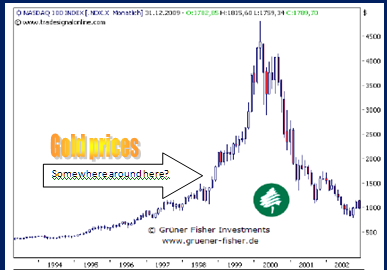
To elaborate on this – my view (and it may NOT be the right one), here are a few graphs that show the developments of bubbles,
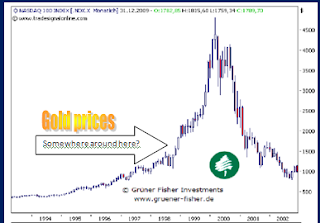 |
| the dot.com bubble of 2000 |
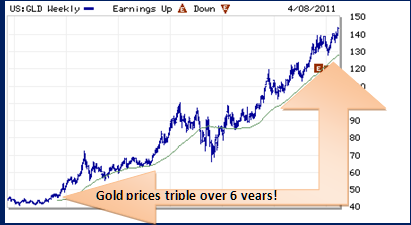
- the gold price rise as I see it (in USD again)
- the dot.com bubble in 2000, – and
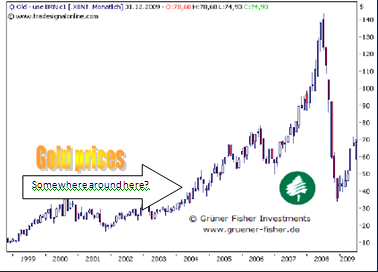
- the oil bubble in 2008.
The price of gold has tripled in six years, yes. By that account the gold bubble level would be where indicated in the chart for the dot.com bubble, – or the oil bubble. That is to say that people may sell you a bubble because they are greedy and want prices to rise even faster.
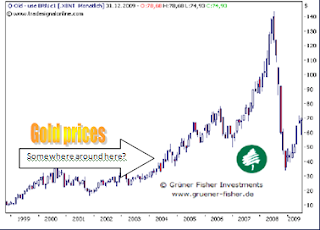 |
| the Oil Bubble of 2008 – setting off the crash in stocks |
But with gold prices it won’t work, because of its relationship with the buying power of global currencies. Anyone wishing for a gold bubble should instead worry about the accompanying hyperinflation, a devaluation of currencies, bankrupt states, and a return to pre-world war conditions!
That’s it for today.
I am off to Europe to attend the Zurich Investment Symposium organised by iFAST. But I will continue to watch the markets, – and tell you more soon.
– AHEM, I realise that I have yet to deliver the JAPAN – Part Three report with detailed outlook for a variety of markets and asset classes following the most recent spade of disasters. It is in the works, – but I wanted to wait a few more days, to see whether the expected turning window for this week works – or fails. First quarter earnings in the US are said to be promising, but how will market participants react