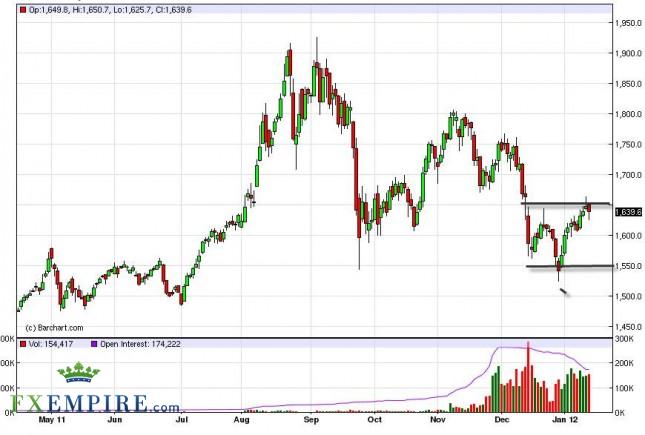
Gold markets fell for the session as traders around the world took profits. The $1.650 level is massive resistance, and it looks like the area has held as of the close on Friday. The candle is a bit of a hammer shape, and the candle suggests that there is pressure building to the upside. However, if the market breaks below the lows on Friday, this would actually make it “hanging man”, which is a bearish signal. Because of this, we think that a close above the $1,650 level on the daily chart is needed to see further upward momentum. In order to see bearishness, we need to see a break of the bottom of the days’ range for Friday. At this moment, we need to see a break of one of those levels in order to get involved.

Gold Forecast January 16, 2012, Technical Analysis
Originally posted here


