
Gold 1 week chart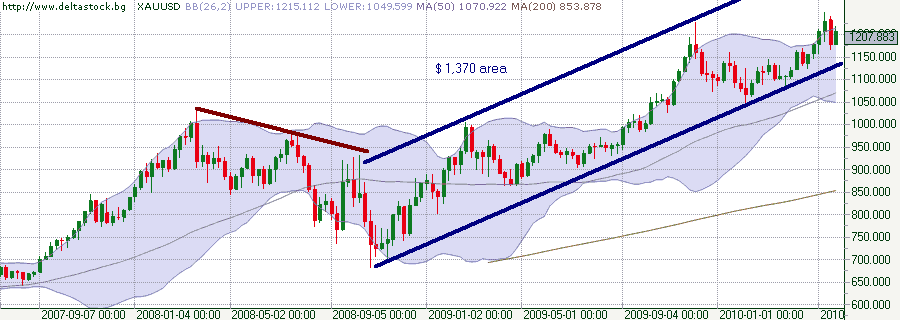
On weekly chart (from 2007-09 to 2010-05) we can see massive triangle in brown, and then parallel channel in blue. Channel target is in ~1,370 USD area. Bottom is @ ~1,140 USD area.
Gold 1 day chart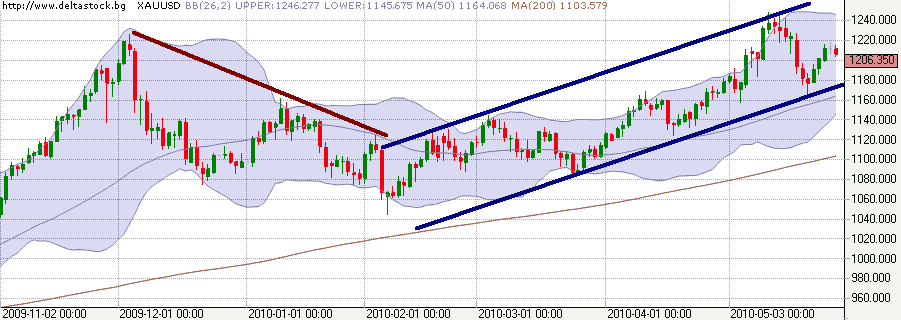
On dayli chart (from 2009-11 to 2010-05) we can see very simillar pattern – massive triangle in brown, and parallel channel in blue. Channel target is ~ 1,270 USD area. Bottom – 1,175 USD.
Long ago I noticed this patterns. It was strange for me when I saw same patterns are formed in different time frames… But pattern like this often happen in gold. It is almost like a fractal. Of cource the pattern appear because human emotions are “captured” into the gold market and market in general.
Gold 4h chart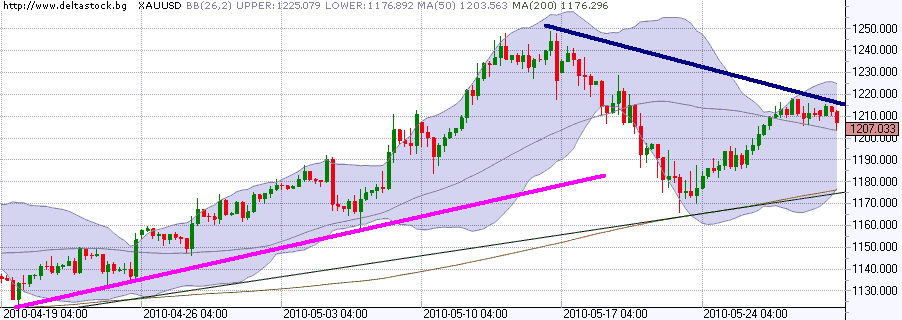
4 hours chart is insignificant for the moment, except price formed a small top.

