
Gold is clearly primed for a break-out … but in which direction?
For the past two months the price of gold has been travelling within an increasingly narrow descending triangle pattern.
That kind of pattern on the price chart (see below) is typical of price consolidation — and price consolidation is always followed by price expansion.
The high-to-low range gets narrower and narrower … until eventually the price breaks out in a rapid, explosive movement with heavier volume and much greater momentum.
Gold is getting ready to make that kind of move. And if you catch it early the profits are terrific.
There’s only one problem: we don’t know which direction the price will go.
But we do know how to trade the move that is coming.
Take a look at this price chart. It shows the daily prices for the gold futures.
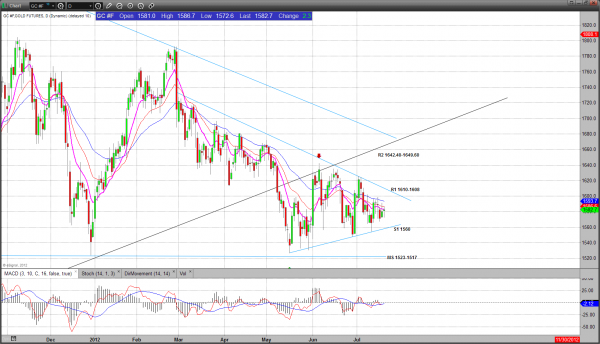
There’s a clear triangle forming, with a sequence of lower highs and higher lows. At point – some point soon – that pattern will be broken.
Regardless of which direction the break-out takes – up or down – the trading method is the same.
- identify the breakout level;
- watch for a pull-back to the break-out point; then
- enter the trade (either long or short) in the direction of the original breakout with a protective stop a few points below (for an upside breakout) or above (for a downside breakout) the original break-out point.
For the coming breakout in gold, here are a few key levels to watch:
A break above 1618 confirms a bullish breakout; a move below 1555 confirms a bearish breakdown. If the price remains inside the key range 1600 – 1555, it is continuing to be range-bound within the triangle pattern. Keep watching and wait for your price before entering the trade.
To see Nat’s weekly gold updates, visit her blog at www.nturus.com/gold. To see them every week, register, and we’ll send you the updates by e-mail.

