
By: Ogo Nwanyanwu

In the first Matrix movie when Keanu Reeves’ character, Neo, sees the same black cat twice, he casually blurts, “whoa, deja’ vu” and everyone on his team freezes. In the Matrix, deja vu’ is a glitch signaling something has changed, thus chances for survival in the Matrix decrease. However, in the world of technical analysis, deja’ vu amounts to acute pattern recognition and with it, increase the chances for an active investor to profit or mitigate risk.
Gold recently tested its 2-year upward trendline reaching $1308.10 in late January, capping off two months of relative weakness against the stock market and five months of relative under performance compared to silver. The 8% correction from it’s all-time high of $1430.60 even had some goldbugs and TV personalities on CNBC claiming the decade long gold trade was over.
After rallying $60 off that major trendline to a intra-day high of $1367.80 on Feb. 8th of this year, the precious yellow metal has now settled into a tight base, wedged above its 20-day simple moving average (SMA) and below its 50-day SMA. We have seen this set-up in gold before.
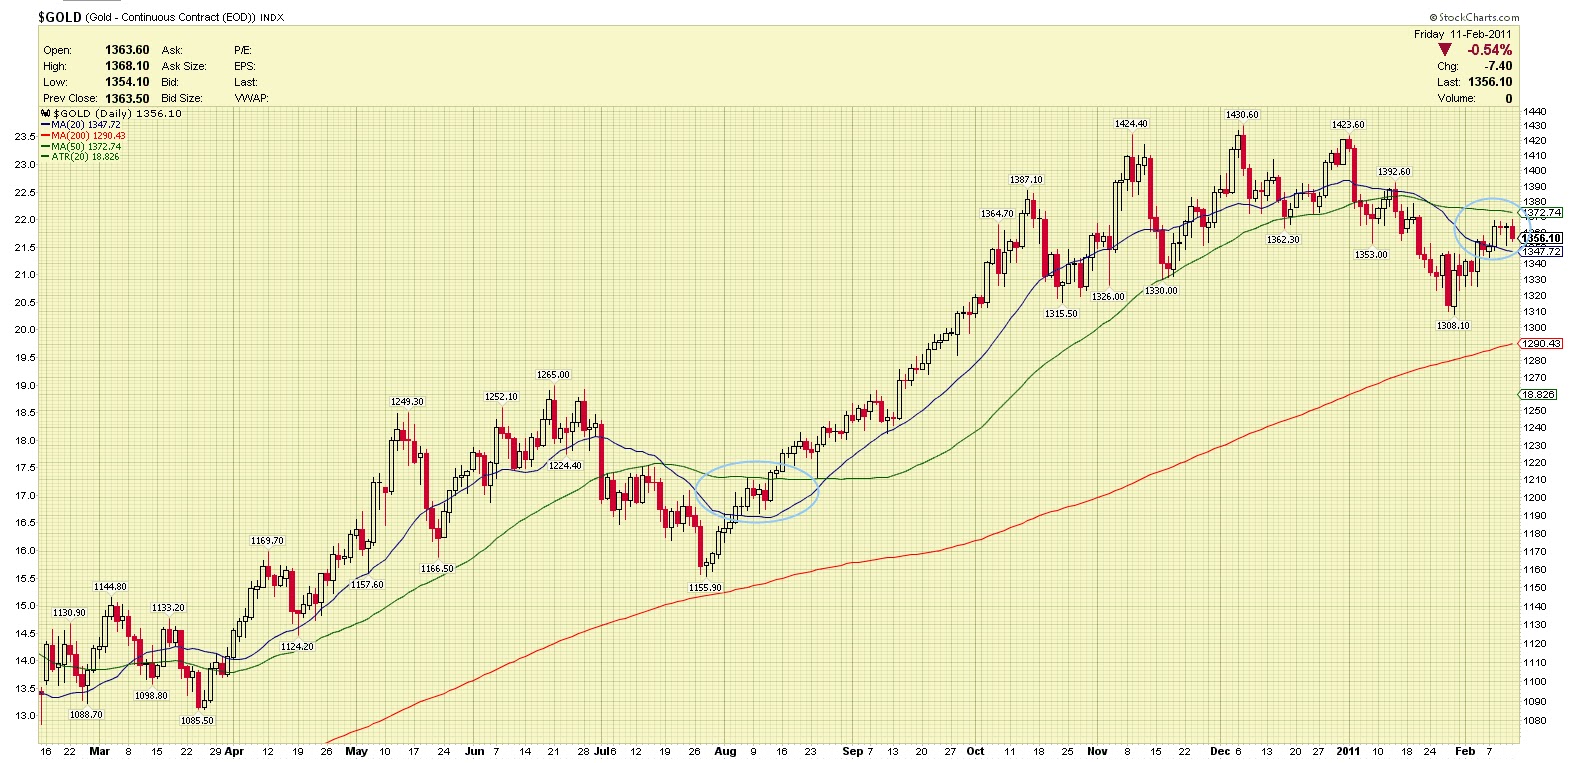
Last year on July 28th , gold completed an 8.6% correction, hitting an intra-day low of $1155.90, coming within shouting distance of its 200-day SMA, but more importantly affirming its major trendline support as seen on the chart. Over the next eight trading days gold rallied $55 to $1210.70, then settled into a base, wedged above its 20-day SMA and below its 50-day SMA. The precious metal based for 3 days and on the 4th day closed above $1211, starting a 15% rally that would last 2months.
This deja vu moment in gold now gives active investors a potential blueprint to follow. A close in gold over the $1368 level or $133.50 level in the SPDR Gold Trust ETF (GLD) provides a long entry, with a close below the current 20-day SMA of $131.50 as the out. The downside risk amounts to $2 or 1.4% and the upside target, previous 52 week highs of $139.54, would be a $6 move creating a 3 to 1 reward/risk ratio.
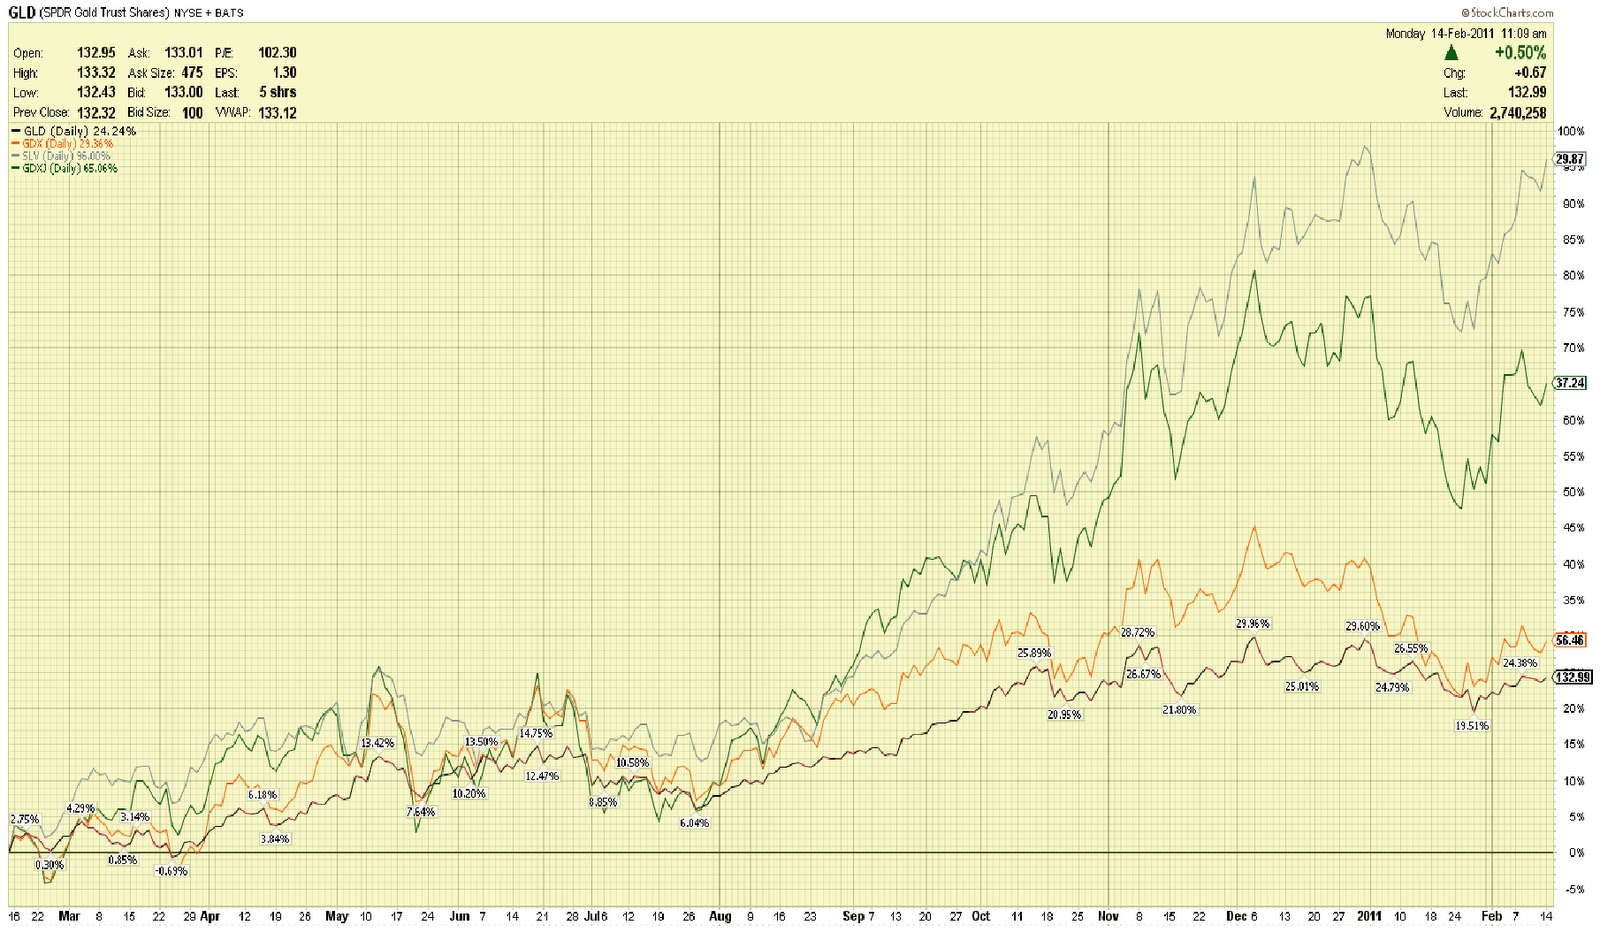
An active investor seeking greater upside potential can use the GLD to trade silver stocks/etfs or junior gold mining stocks/etfs as the SLV and GDXJ have outperformed the GLD and GDX in since July 2010 (see chart).
In the Matrix, Neo’s deja vu was followed by an ambush of his group. For active investors following gold, this deja vu moment provides a blueprint and opportunity.
*DISCLOSURE: No position (subject to change in next 72 hours)
This material is being provided to you for educational purposes only. No information presented constitutes a recommendation by T3 LIVE or its affiliates to buy, sell or hold any security, financial product or instrument discussed therein or to engage in any specific investment strategy. The content neither is, nor should be construed as, an offer, or a solicitation of an offer, to buy, sell, or hold any securities. You are fully responsible for any investment decisions you make. Such decisions should be based solely on your evaluation of your financial circumstances, investment objectives, risk tolerance and liquidity needs. Visit the T3Live Homepage, Virtual Trading Floor, and Learn More About Us.

