
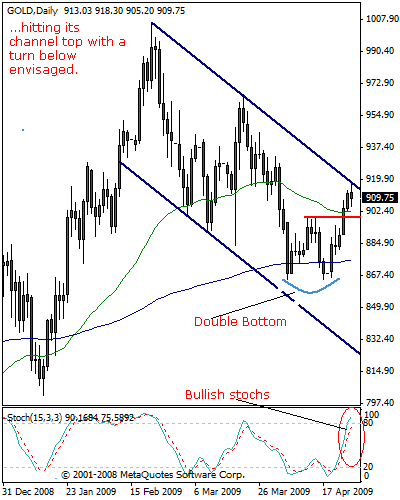
GOLD: Testing Declining Channel Top
GOLD: While GOLD has confirmed its double bottom pattern and headed higher in continuation of its recovery from the 865.90 level, its April 20’09 low, it was seen running into overhead resistance at the 918 level, which is the location of its declining channel top today. Though the recovery highlighted above is still biased to the upside, its channel top is expected to hold and force a correction. In such a case, its April 15’09 high at 399.38 will be targeted at first with a loss of there paving the way for a run at its daily 200 ema at 875.75 and then its double bottom low at 864.50.Below the latter will reverse its current upmove and trigger the resumption of its short term declines initiated at I, 007. Alternatively, if a break and hold above its declining channel occurs, a move higher should shape up towards the 932.87 level, its April 01’09 high. Beyond there will leave the metal targeting the 945.60 level, its Mar 26’09 high ahead of the 966.70 level, its Mar 20’09 high. Its daily stochastics remains supportive of this view as it continues to point higher. On the whole, although it is nearer term pressured to the upside, its weakness activated at the 1,007 level remains valid as long as it maintains within its declining channel.
This is an excerpt from FXT Commodity Strategist Plus, a 5-commodity (Gold, Silver,Crude Oil,Wheat & Corn)model analysis. Take A One Week Free Trial atwww.fxtechstrategy.com
This report is prepared solely for information and data purposes. Opinions, estimates and projections contained herein are those of FXTechstrategy.com own as of the date hereof and are subject to change without notice. The information and opinions contained herein have been compiled or arrived at from sources believed to be reliable but no representation or warranty, express or implied, is made as to their accuracy or completeness and neither the information nor the forecast shall be taken as a representation for which FXTechstrategy.com incurs any responsibility. FXTstrategy.com does not accept any liability whatsoever for any loss arising from any use of this report or its contents. This report is not construed as an offer to sell or solicitation of any offer to buy any of the financial instruments referred to in this report.

