

If you’ve been on the site for the last few years, or seen me on CNBC or theStreet.com, you know I love to trade gold. I first mentioned gold publicly in December 2008 on CNBC when it was trading at $850/ounce. I have not held the SPDR Gold Trust ETF (GLD) for that entire move, but rather traded it technically in order to manage my risk and be in large size for the ‘meat and potatoes’ moves.
In my opinion, the nature of a speculative play like gold makes it an ideal vehicle for active traders. There is a lot of emotion involved in the gold trade, which is where good active traders thrive if they have the right mindset. No matter your approach to the market, gold and silver should be on your radar. If you are an active trader, you can get cash flow from quick, calculated moves, and if you are a long-term investor gold provides a great hedge against economic hardship, political turmoil and inflation.
In the fourth quarter of 2010, Gold put in a triple top, signaling that the metal needed to digest and pull-in before making its next moves. During January, gold was having an identity crisis. There was not distinct price driver. Inflation had remained modest, the Eurozone crisis headlines had abated, and investors were hungry for stocks that could do no wrong.
On January 27th we saw capitulation price action and volume to the downside, which then turned into a king and queen candlestick formation wehn all of those losses were erased the next day. That action put gold firmly back on my radar for higher prices. Since that point, GLD has rallied more than 12 points back to the highs. Along the way, there have been a few technical entries that we have highlighted as technical buy areas.
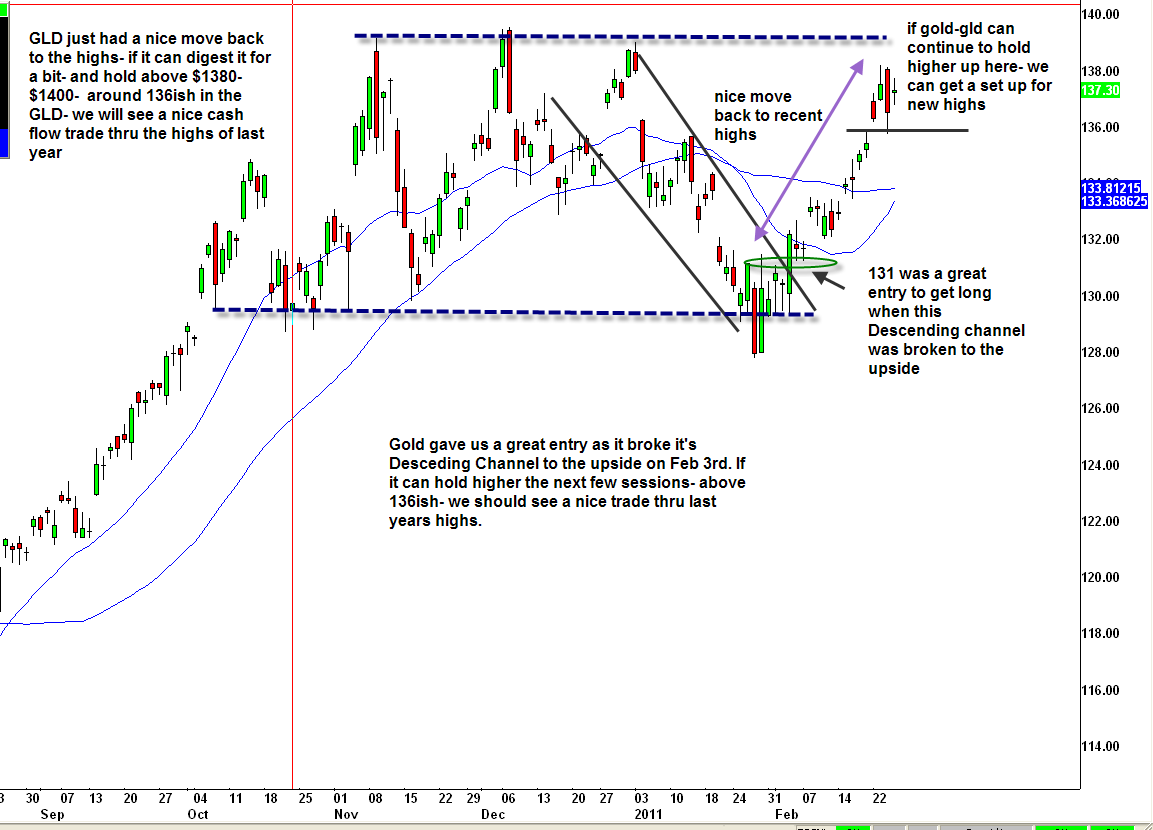
The late January reversal may have put gold back on our radar, but the technical buy area came February 3rd on a break of the downtrend about $131. (apologies for the ‘quick and dirty’ charts, but timeliness and authenticity is the goal)
After the break of the downtrend, gold has continued to put in mini-consolidations that we highlighted as buyable. Another came on February 15th.

Then on February 25, I put a blog out that noted that I would be watching the price action closely. If the GLD held above $136 (which it did) I said I would look to enter for a move back to new highs (which we got).
I do not highlight these old charts to gloat or pound my chest, but just to educate and illustrate an effective way to trade gold (or another stock you like) actively without just buying a ‘X’ amount of shares and holding them. By using technical levels and tilting risk-reward in your favor, you can get more out of the trade and manage your risk better than you would by just buying and holding. At this point gold needs some rest after its momentum move through highs, but I am holding a small position with my 2011 price target of $1700-1800 still intact. Along the way I will trading the patterns, tiering in and out, so stay tuned!
*DISCLOSURE: Long GLD
This material is being provided to you for educational purposes only. No information presented constitutes a recommendation by T3 LIVE or its affiliates to buy, sell or hold any security, financial product or instrument discussed therein or to engage in any specific investment strategy. The content neither is, nor should be construed as, an offer, or a solicitation of an offer, to buy, sell, or hold any securities. You are fully responsible for any investment decisions you make. Such decisions should be based solely on your evaluation of your financial circumstances, investment objectives, risk tolerance and liquidity needs. Visit the T3Live Homepage, Virtual Trading Floor, and Learn More About Us.

