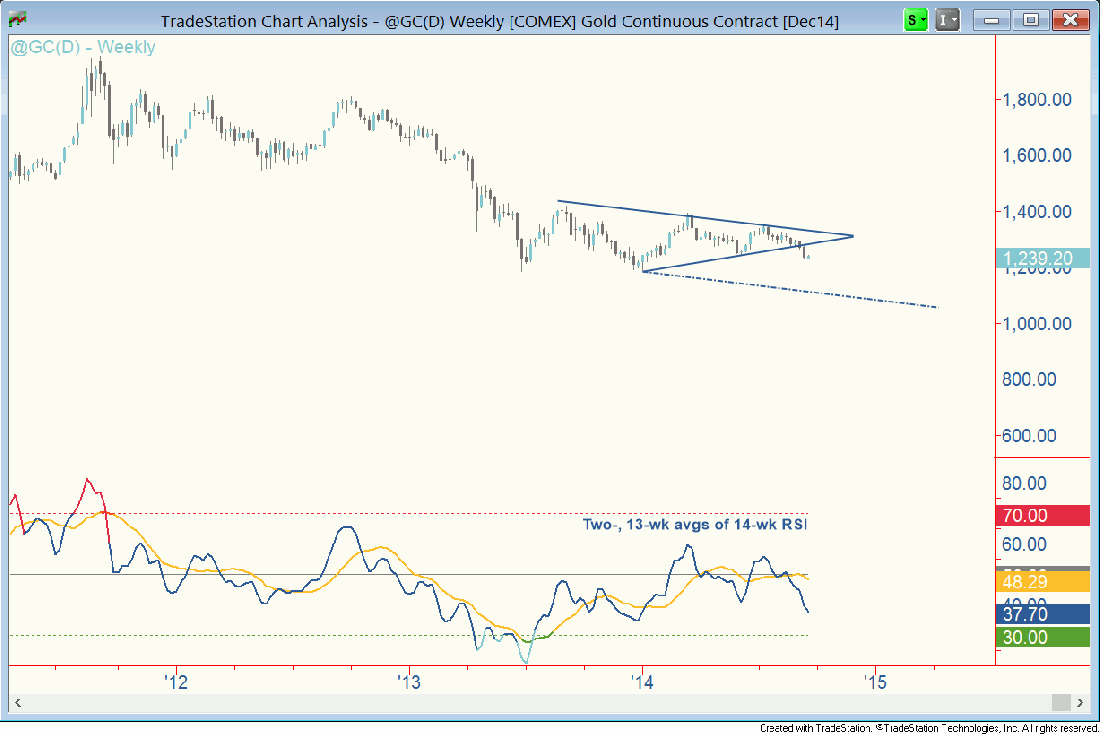
On September 2 I wrote about an attractive short scenario in gold associated with a breakdown from a large symmetrical triangle formation. That breakdown ended up being pretty decisive. The evidence favors further downside ahead.
Technical Outlook
Specifically, in addition to the poor price structure, I’m looking at weekly momentum. Take a look at RSI averages at the bottom of the accompanying chart. The slow average (orange) stalled around the 50 midline in April. In the past two weeks, the indicator dipped. This tells us two things. One, a lower high compared with April is emerging. Two, the indicator has failed to mount technical support at the midline.

Big Picture
This type of behavior in the context of a downtrend (gold has been in a cyclical bear market since 2011) often precedes the next leg lower. What’s more, the fact that momentum isn’t anywhere any oversold condition that would signal seller exhaustion points to substantial downside potential. If gold were to reach the bottom of Zoro’s Signature, we could see it approach the 1,000 mark in the intermediate term.
Listen To The Market
I’m staying bearish on this market until the market tells me otherwise. I still don’t see any sign of the uptrend in the greenback changing either, which bodes well for deeper losses in gold as well.
Good trading, everyone.


