Just a reminder, these charts are posted as examples of the trades on the nightly COT Signals email. These trades will help illustrate the mechanics that go into creating the nightly email.
Gold’s sell off has been tied directly to the Dollar’s rally. However, the sell off was exacerbated by stop loss selling under the $1075 area. Many traders who bought gold all the way back to mid December had held this as their Maginot line. Once violated, we saw a mass exodus to cash.
One of my long held market beliefs is that, “The market will act in such a way to screw the greatest number of participants at any given time.” I think that’s what we’ve seen here.
The break below $1075 not only washed out several weak long positions but it also triggered many short entries by those waiting patiently for confirmation of the chart pattern before selling.
Currently, the market is right back to, and above, that same $1075 area. The washed out longs are wondering if they should buy back in and the shorts are wondering if they just got suckered.
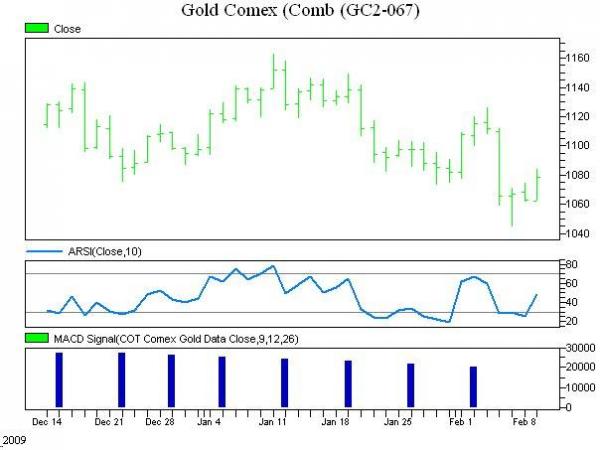
Technically, we view this as a buying opportunity. Our commercial trader’s momentum filter says that they are buying this break. This also follows with the outright COT numbers which show a large commercial net short position and their propensity to buy breaks and sell rallies.
Furthermore, our proprietary triggers are showing this washout lacks any meaningful strength as evidenced by the divergence in the indicator based on the $1073 lows of a couple weeks ago.
We are using these price levels to buy Gold. We are placing our protective sell stops under the current swing low of $1044.50 and looking for the market to rally from here.
Please call with any questions.
866-990-0777