
After a month of range-bound trading, the Gold futures may be reaching a decision point.
Since the middle of July the gold futures have travelled within a relatively narrow range, from about 1585 to 1630. But there are signs the price may be ready to move outside the range.
At this point it is not clear if the move will be up or down.
But there is a way for traders to hedge their bets, so they can make money no matter which direction the market moves: trade the range until a breakout is confirmed; then trade in the direction of the break out after the market pulls back.
Look at the chart:
Gold futures, continuous contract
Daily bars to August 17, 2012
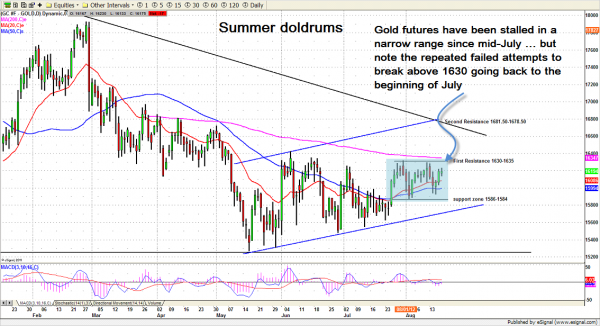
Gold futures are moving sideways. But a buy signal was instituted when the moving average lines (the red and blue lines on the chart) crossed.
For the short term that buy signal is still intact, as long as the 20ema line holds above 50ema line. But long term resistance lies ahead of the current price, and it will not be easy for the bulls to cross over it.
The 1635 level is resistance and 1589 level is support. As long as gold doesn’t break through those resistance or support levels, a sideways range move should be expected; traders will sell the top of the range and buy at the bottom.
But watch for a confirmed breakout – up or down – from that trading range.
- A break above 1642.50 could trigger a short squeeze and price would continue popping toward the long term downtrend line around 1681.50-1678.50.
- A move under 1584 will give traders the impression that 1563 level needs to be retested soon.
If you want to learn more about trading futures, Naturus.com is offering a special discount on training programs that could have you trading profitably by New Years.
Click this link for the details: www.2.naturus.com

