Wednesday 10 February 2010
The singlemost important information one can have about a market, and we
repeat it often for a reason, is knowledge of the trend in which one is trading,
as well as an awareness of the trend of the next higher time frame. Recently,
we presented a weekly chart perspective of the grains, Grains – Getting More
Interesting, [click on: http://bit.ly/d9PH5V]. Today, we will look at daily charts
to see if a smaller time frame provides any clarity.
As an aside, let us add that the technical picture we said that may be showing
potential bottoming activity flies in the face of most fundamentalists who pretty
much see still lower prices to come. We have not advocated long positions,
only because of the trend being down, and not due to fundamental concerns.
Corn has had the stronger chart formation, having retraced less of its gains
since last Fall. It does continue to hold the current trading range above last
Fall’s trading range, a plus. What draws immediate attention is the increased
volume bar from yesterday, the 9th, and the results reflected by a rally with a
mid-range close. The close tells us there was a stand-off between buyers and
sellers. That the volume increase was on a rally day suggests a poor response
for upside progess. That would make corn more vulnerable to a break.
If and how a retest of the recent 347.5 lows hold, or not, will provide important
information as to the health of this market.

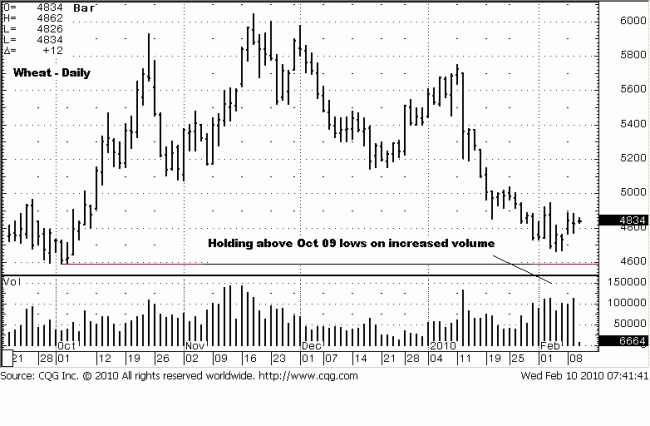
Wheat fell in between corn and beans as to relative strength, and Wheat
continues to retest its October lows, again on increased volume. Like corn,
wheat had an increase in volume on the 9th, not quite as pronounced, but the
close was also mid-range on an inside day bar. This lateral movement merely
reflects the trading range, and one cannot draw clear conclusions until price
breaks one way or the other. It is interesting that the large range down day,
6 bars from the end, had no follow-through continuation. Why didn’t sellers
press their cause? Again, we are just making observations, for now.

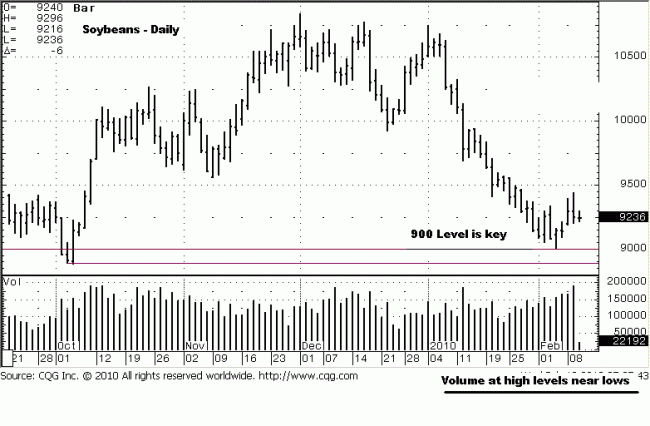
Beans have been the weakest, and they, too, had a high volume day on the
9th, but the configuration of the daily range can be taken in a different light,
even though it appears to have been the weakest close of the three grains.
The close was on the lower end of a wider trading bar. The day belongs to
sellers, based on the increased volume and poor position of the close, but it
did not break the previous day’s low, when it easily could have. Sometimes,
these kinds of bars, and where they occur, can prove to be other than how
they appear. Time will tell.
We do not gain any further clarity from a look at the daily charts. In fact,
they all back the potential for a turnaround, as was suggested from reviewing
the weekly charts. We started with acknowledging the importance of the trend,
and we end on the same note. The trend remains down. If a turn were to
occur, it will take more evidence than we now see. The daily charts are not as
compelling as the weekly seem to be, so continue to exercise patience.
No commitment, from our perspective.


