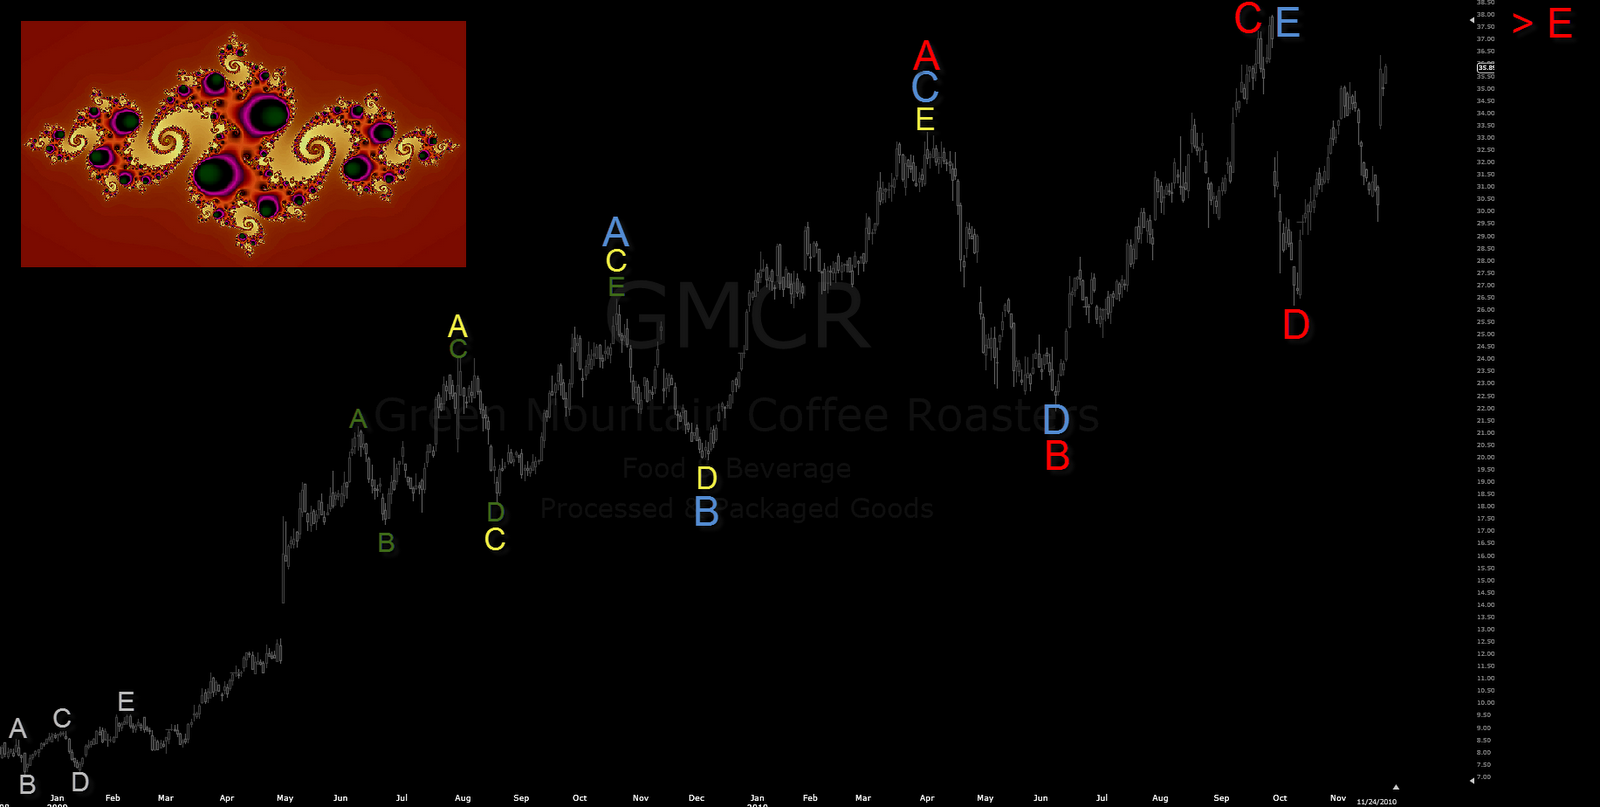
It is not physically located in the area which would be interested me and not going to be either but it is so fun chart that decided to post it.
You have 5 similiar expanding EW triangles in it. Pure harmony fractal chart how it trades, expanding pattern.
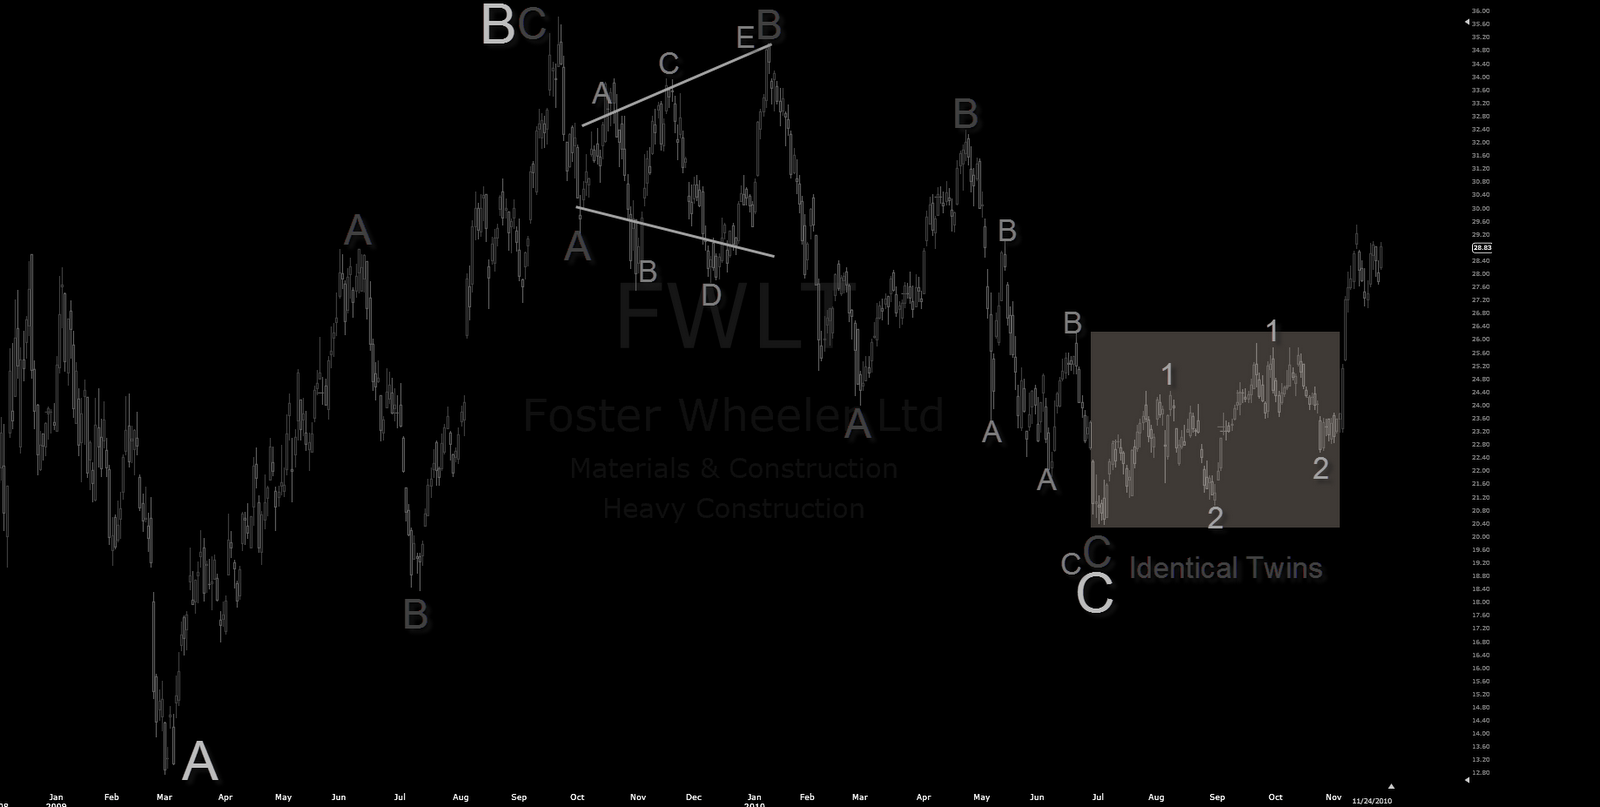
Foster Wheeler is another nice fractal case. That looks good bullish pattern but a bit too good start allready seen, it is likely allready inside of “god knows” how many degree W3´s. That chart does not differ much from previous post UDRL chart either. Expanding triangle in the top after 3 up, which drops with next swings as corrective structure down with 3 again for W2 retracement area, then EW consolidate & ending pattern for it and it´s about placed.
There´s too many of them. Many major caps from nasdaq are run too far away for my taste, pure progressive run with daily charts without any correction, it is difficult to breake any degree for them & find bottom corrective patterns in here because there is no any – just new orthodox highs runaways with daily charts.
For me it´s allways better to act on there where things are about going to change, not trying to catch any high flyers where I can burn my fingers, just because price goes is not reason for me to go anywhere – without potential physical location with any instruments I am just not interested of them. With EW, only real and potential physical location is the one which makes sense to trace and track and they are; W2 and C waves and end of fifths and in that order.
More complex is better also, they response is more agressive once something complex is ended.
Good Night & Happy ThanksGiving for US peoble,
Market Geometry