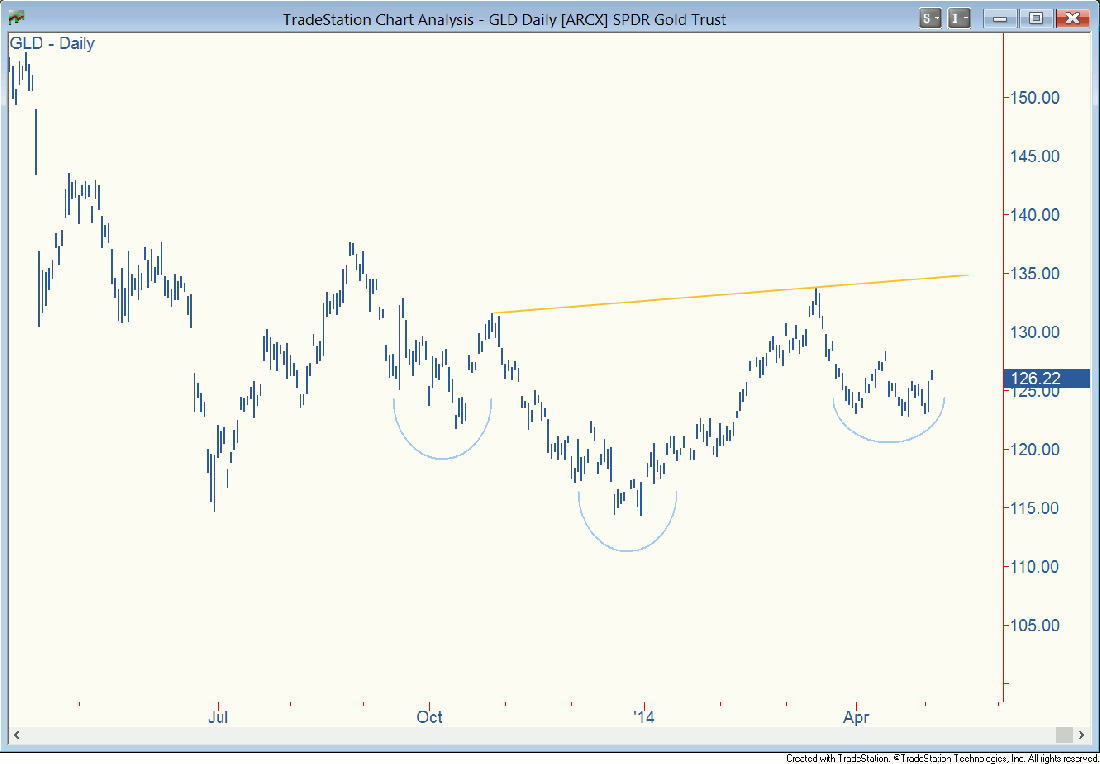
The GLD (SPDR Gold Trust) is tracing out the right shoulder to a large inverse head and shoulders bottom, creating an attractive reward-to-risk scenario for long entry by position traders and even investors with a longer time horizon.
How It Works
This pattern comprises a nadir encompassed by a higher low on either side. The second higher low shows selling pressure wasn’t strong enough to take price to new depths and signals a possible upside trend reversal. Clearing the neckline – a trendline connecting two short-term highs achieved as the pattern evolved – confirms a breakout, but you’ll often be late if you wait that long to buy. The best prospects, in terms of reward and risk control, are usually when the right shoulder is forming.
Key Levels
The current pattern is defined by the low last October (left shoulder), the last day of 2013 (head) and the recent lows around 123.00 since early April.

Risk Is Defined
One particularly nice thing about this chart as a trade prospect is that risk is well defined and contained. A stop loss placed as low as 120.00, say, would give ample breathing room below that 123.00 floor and translate to a loss of less than 5%.
Target
Initial upside potential is 148.00 – chart resistance based on the lows in late 2011 and the middle of 2012. The neckline of the basing pattern slopes upward. It comes in around 135.00 right now and will continue higher. A conservative reckoning of the measured move (height of the pattern added to the breakout point) is roughly 153.00.
As always, base your exit on a trailing stop such as a moving average, and don’t get married to price targets.
Good trading, everyone.
RELATED READING
The Madness of Crowds: The Eiffel Tower Pattern. Read the story in the Spring TraderPlanet Journal.


